Conditional Skewness and the Returns on Crypto Assets
Much attention is paid to conditional volatility estimates as a measure of risk within the context of asset returns. This stems from the genesis of modern portfolio theory and the concept that efficient portfolios should lie on the mean-variance frontier. As a result, investment efficiency, and therefore risk, are evaluated within the context of risk-adjusted returns, where risk is captured by conditional volatility. However, as highlighted by Harvey and Siddique (2000), the mean-variance optimal allocation framework is optimal only under the assumption that returns of a risky asset are symmetrically distributed around its mean, that is, skewness is zero.
This is often not the case for traditional asset classes, perhaps even less so within the context of crypto asset returns. In addition, investors often do care about downside risk within a diversified portfolio. In other words, there might be valid reasons to assume that perhaps too much attention is paid to mean-variance efficiency, and related performance measures such as Sharpe ratios, while investors’ aversion to large losses may be often overlooked.
However, the economic foundation for asset pricing with skewness is strong, although often overlooked. Adding an explicit term for skewness within an otherwise conditional maximum Sharpe ratio is intuitive and is grounded on the assumption that risk does not map directly with volatility, that is, skewness matters (see, e.g., Bianchi et al. 2022). The intuition goes back at least to Rubinstein (1973) and Kraus and Litzenberger (1976); in the basic Capital Asset Pricing Model (CAPM) risk is defined as an asset’s contribution to the total portfolio volatility. By adding skewness, the definition of risk is expanded. That is, portfolio risk in a well-diversified portfolio should also include the contribution of each asset to the portfolio skewness, i.e. co-skewness.
In this report, we try to expand the notion of portfolio risk within the context of crypto assets and investigate how both individual assets, and the crypto market portfolio overall, contribute to the downside risk of an otherwise aggregate equity portfolio. Specifically, we follow the procedure outlined in Harvey and Siddique (2000) and investigate the properties of the so-called “skew beta”, which represents the contribution of a given crypto asset to the conditional skewness of a broader equity portfolio. The results highlight that systematic skewness is particularly important within the context of cryptocurrency markets. A result which is often overlooked in investment risk management practices.
A first look at skewness in crypto assets
We first examine the time series properties of realised skewness for a large cross section of more than 300 crypto assets from October 2017 to September 2022. The cross section covers between 90% to 70% of the total market capitalization of crypto assets. Specifically, we compare the realised skewness of crypto with the realised skewness from a broad value-weighted equity market portfolio. Given that we are interested in measuring the asymmetry of the distribution of returns, we construct a measure of ex post realised skewness based on daily returns standardised by the realised variance, as in Amaya et al. (2015). Specifically, let RVt represent the realised variance (see report), we approximate the conditional returns asymmetry each month as
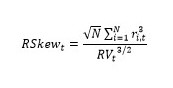
The interpretation of this measure is intuitive: negative values indicate that the return’s distribution has a left tail thicker than the right tail, while positive values indicate the opposite. An appealing feature of this approach is that it can be easily implemented by an investor in real time and does not rely on any parameter estimation. In addition, by using a non-parametric, model-free approximation of the conditional skewness we can abstract from potential existing differences in the underlying data generating process (see Bianchi et al. 2022 for a more structured parametric approach). This is particularly convenient when comparing two classes of investments which, a priori, do not necessarily share the same economic fundamentals, such as equity and Bitcoin.
The right panel of Figure 1 reports the average realised skewness RSkewt from the full cross section of crypto assets. Notice the realised skewness is scale invariant, that is, it does not depend on the fact that returns are expressed in decimals or percentage. Two facts emerge: first, the average realised skewness of cryptos is slightly negative (-0.07). This is not entirely unexpected since this represents a cross-sectional average of time-series means. By averaging out both in the time series and in the cross section the variability of the realised skewness is substantially diluted. Second, and perhaps more importantly, there is a substantially cross-sectional dispersion in the realised skewness across crypto assets, with the average RSkewt spanning from almost 1 to an extreme -2 value. Taking out these extremes, the skewness values, the RSkewt are in the range of -0.5 to 0.5.
Figure 1: Realised skewness of crypto assets vs equity market portfolio
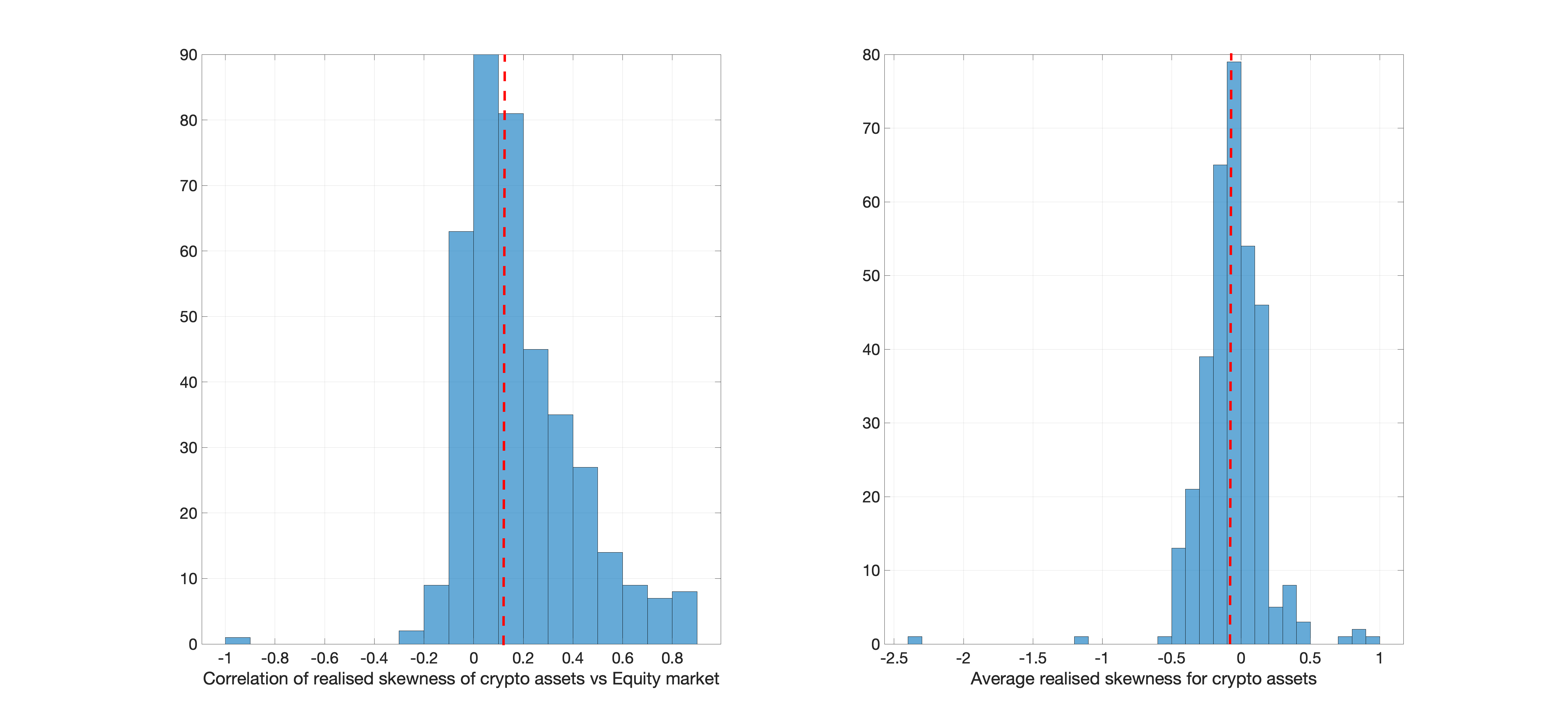
The left panel of Figure 2 reports the correlation between the RSkewt obtained from the equity market portfolio and the realised skewness obtained for the full cross section of crypto assets as outlined above. The average correlation between crypto and equity realised skewness is slightly positive (0.11) although rather dismal in magnitude. Nevertheless, the cross sectional variation in correlations is points to the heterogeneity that characterises crypto assets. The correlation with the realised skewness from equity markets is as high as 0.8 for some of the crypto assets, and as low as -0.2 for some other.
The results in Figure 1 suggest that, on average, there is a substantial variation in the amount of realised skewness across crypto assets, as well as their correlation with the returns asymmetry on the equity market. This has obvious consequences for investment decision-making. For instance, one could argue that the systematic effect of introducing a given crypto asset in a well-diversified equity portfolio could potentially depend on its skewness. Indeed, all else being equal, investors should prefer portfolios that are right-skewed to portfolios that are left-skewed. This is consistent with the Arrow-Pratt notion of risk aversion. Hence, assets that decrease the portfolio’s skewness, i.e., that make the combined portfolio left-skewed) are less desirable and should therefore command a higher risk premium for investors to pour in. We are going to investigate this aspect in the next section.
Returns skewness and asset pricing
The various asset pricing implications of conditional skewness can be viewed through the lens of a standard stochastic discount factor (SDF) specification. For instance, Harvey and Siddique (2000) have shown how conditional skewness enters the SDF by assuming a quadratic pricing kernel in the market returns. The intuition is that since adding an asset with negative co-skewness with the market makes the resultant portfolio even more negatively skewed, assets with negative co-skewness should carry a risk premium as they exacerbate the probability of large losses. On the contrary, if an asset has no co-skewness with the equity market portfolio, then adding that asset to the market portfolio should not exacerbate risk. We follow Harvey and Siddique (2000) and construct a direct measure of co-skewness between a given crypto asset i and the equity market portfolio βskew defined as
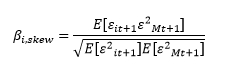
Where εmt+1 = rmt+1 - rm εit+1 are the demeaned returns and εit+1 = rit+1 - αi - βi rmt+1, the residual from the regression of the crypto asset returns rit+1 on the contemporaneous equity market excess returns rmt+1. In this respect, βi,skew represents the contribution of a given crypto asset to the skewness of a broader equity market portfolio. A negative value of βi,skew means that a given security is adding negative skewness to the equity portfolio. On the other hand, a positive value means that a given security mitigates downside risk of the equity portfolio, that is, add positive skewness. According to economic theory, a negative value of βi,skew should command a higher risk premium.
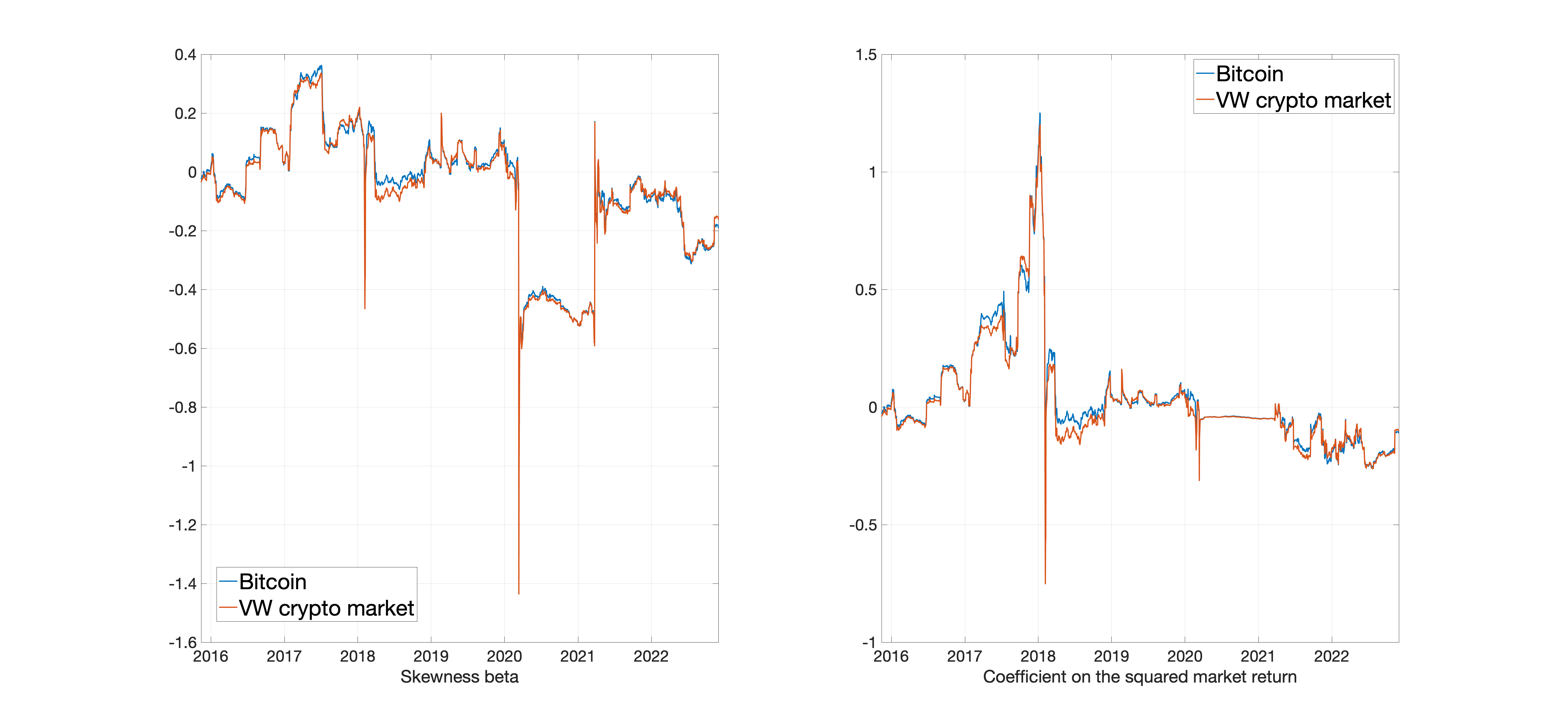
The left panel of Figure 2 shows the recursive estimate of βi,skew for both Bitcoin and a value-weighted crypto market portfolio in addition to the equity market. The recursive estimates are based on a rolling window of 260 trading days from early 2016 to September 2022. Interestingly, there is a considerable time variation in the contribution of Bitcoin/Crypto market to downside risk of an otherwise standard well-diversified equity portfolio. The skew beta is positive through the early part of the sample, up to the onset of the Covid-19 outbreak in 2020. This suggests that Bitcoin and crypto assets at large had a positive effect on downside risk for equity. This is consistent with a large body of evidence published at the time suggesting Bitcoin was a diversifier asset when coupled with more traditional investments, such as equity, bond and commodities (see Bianchi 2020). However, the value of βi,skew turned negative throughout the bulk of the pandemic period, until late 2021, and towards the end of 2022. This suggests that opposite to the pre-pandemic period, Bitcoin/Crypto assets were indeed adding downside risk to equity portfolios. Put differently, there has been a positive correlation between downside risk in crypto assets and equities especially during the Covid-19 crisis. Again, this confirms and expands some of the intuition we outlined in a previous article, which focuses on the correlation in tail risk between crypto assets and traditional asset classes (link to article).
The right panel of Figure 2 reports an alternative measure of skewness beta based on a squared CAPM formulation as follows:
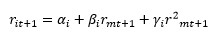
This quadratic form implies an asset pricing model where the expected returns on a given cryptocurrency are determined by its conditional covariance with both the market return and the square of the market return, that is, conditional skewness. The figure reports the recursive estimate of γi based on a rolling window of 260 trading days. The evidence from the squared CAPM is less clear compared to βi,skew. There is a positive correlation between Bitcoin/Crypto market returns and the squared of the equity returns up to the crash of 2018, but not much else since then. This is perhaps not surprising; as a matter of fact, as highlighted by Harvey and Siddique (2000), the skewness beta βi,skew has two main advantages compared to γi. First, it is based on the return residuals εit+1, which are independent on the market returns rmt+1 by construction. Second, the skewness beta is similar to a traditional, linear, CAPM formulation. That is, βi,skew is analogous to a factor loading.
Figure 2: Skewness betas for Bitcoin and a crypto asset market portfolio
The cross-sectional distribution of skewness betas
Figure 2 provides aggregate evidence on the effect of crypto asset investments on equity downside risk over time. We now explore a more granular cross-sectional dimension by looking at the distribution of βi,skew for more than 300 crypto assets as outlined above. The left panel in Figure 3 shows the estimation results. Two facts emerge: first, and perhaps not surprisingly, there is considerable variation in the marginal contribution to equity tail risk across crypto assets. The estimates of βi,skew range from 0.3 to -0.4, that is, while some crypto assets tend to add negative skewness to the equity portfolio some other assets tend to mitigate downside risk in equity markets. Put differently, the evidence is mixed. Second, and perhaps more interestingly, the average value of βi,skew in the cross section is slightly negative. This suggests that, at least over the sample under investigation, crypto assets, on average, tend to exacerbate downside risk compared to a well-diversified equity portfolio. This is not surprising to most investors, given the extremely volatile nature of crypto assets, especially since the outside of the Covid-19 pandemic first, and the war in Ukraine more recently. Again, this is consistent with some of our prior analysis on tail risk in crypto assets (link to article).
Figure 3: Cross-sectional distribution of skewness betas
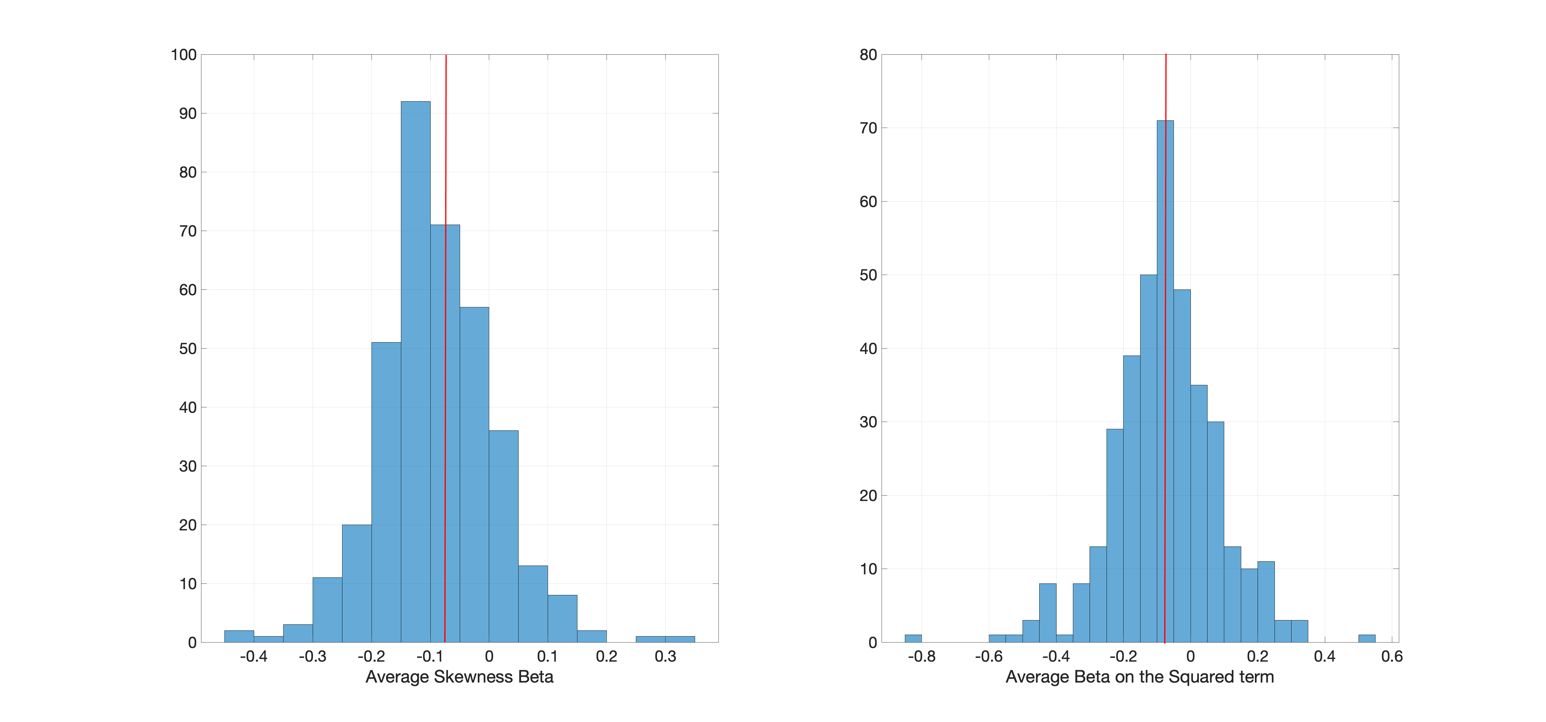
The right panel of Figure 3 offers a similar perspective. That is, there is considerable variation in the estimate of γi, as per the squared CAPM above, across crypto assets. The estimates range from -0.8 to 0.5, with a slightly negative value of -0.1 on average across assets. However, for the vast majority of γi estimates, the value is not statistically different from zero at conventional significance levels. This suggests that the evidence based on γi is perhaps less informative compared to the skewness beta (see left panel).
Conclusion
Asset pricing theory suggests that assets which exacerbate downside risk within the context of a well-diversified portfolio should carry a higher risk premium. The intuition is rather simple: if investors know that the asset returns have conditional co-skewness with the equity market at time t, expected returns on those assets should include a component attributable to conditional co-skewness. In this report we present some empirical evidence that this seems to be the case for crypto assets when nested within a traditional equity market portfolio. We follow Harvey and Siddique (2000) and estimate the conditional co-skewness beta both for more than 300 individual crypto assets and for an aggregate value-weighted portfolio of those assets. Our results show that co-skewness is important, and potentially time-varying, with non-trivial effects on risk diversification between equity and crypto assets.
More generally, this result has important implications in our understanding of the potential diversification benefits of crypto assets when nested in traditional equity portfolios. The evidence suggests that there is a non-trivial correlation between downside risk in cryptocurrency and equity markets. It is worth noticing that skewness beta could arise from a variety of sources, such as illiquidity and/or correlated trading. This is an interesting question that deserves closer scrutiny.
Bibliography
Bianchi, Daniele. "Cryptocurrencies as an asset class? An empirical assessment." The Journal of Alternative Investments 23.2 (2020): 162-179.
Bianchi, Daniele, Andrea De Polis, and Ivan Petrella. "Taming momentum crashes." Working Paper (2022).
Harvey, Campbell R., and Akhtar Siddique. "Conditional skewness in asset pricing tests." The Journal of Finance 55.3 (2000): 1263-1295.
Kraus, Alan, and Robert H. Litzenberger. "Skewness preference and the valuation of risk assets." The Journal of Finance 31.4 (1976): 1085-1100.
Rubinstein, Mark E. "The fundamental theorem of parameter-preference security valuation." Journal of Financial and Quantitative Analysis 8.1 (1973): 61-69.
Disclaimer