Equity Risk Factors and Cryptoasset Returns
In this article we examine to what extent cryptoassets are segmented from traditional asset classes. We explore whether they represent a new asset class by investigating correlations between cryptoassets and a variety of equity risk factors and whether this relationship has changed through time.
Introduction
With the rising price and public awareness of Bitcoin, investors have been drawn to cryptoasset markets by the promise of significant returns compared to the paltry yields often on offer from cash, bonds, and other traditional asset classes. The hyperbolic growth in notional value – with a total capitalisation of around $1 trillion at the time of writing has led investors and academics to more carefully examine the interplay between risks and returns and how they interact with more traditional investment strategies in what is still a relatively unexplored space.
Despite the widespread interest in cryptoassets as an alternative asset class, there is still little consensus on whether they effectively span risks sufficiently differently from more traditional asset classes, such as equity. In this respect, one question keeps looming in the mind of both market participants and commentators: are cryptoassets a novel asset class which is truly segmented, meaning driven by alternative economic forces, from traditional asset classes?
The property of segmentation acts as a double-edged sword for investors. On the one hand, when an asset is “segmented away” from traditional markets it is often because we understand less precisely what factors influence the interaction between supply and demand, and ultimately the price formation process. On the other hand, because an asset class is separated from the rest of the possible asset menu, it tends to offer large and persistent diversification opportunities, especially during bear regimes.
As a result, there is considerable debate as to whether and how cryptoassets may be segmented from more traditional asset classes. In this report, we go one step forward and dig deeper into the segmentation of cryptoasset markets by looking at a large cross section of 153 equity strategies or “characteristic-managed” portfolios as reported by Jensen et al. (2022). We restrict our analysis to value-weighted strategies that can be constructed using the Centre for Research in Security Prices (CRSP) monthly and daily stock files, the Compustat Fundamental annual and quarterly files, and the Institutional Broker Estimate (IBES) database. The ability to look at returns across a wide range of investment strategies, from momentum to value and size, allows us to highlight the relationship between risk factors in equity market and the short-term future dynamics of cryptoasset returns in a more comprehensive way.
A first look at characteristic-managed portfolios
The conventional wisdom posits that although cryptoasset and equity markets are fundamentally segmented, the correlation between the two steadily increased since the outbreak of the COVID-19 pandemic. In this respect, our first assessment asks: how relevant is the information contained in standard equity portfolio returns for cryptocurrency markets and vice-versa? Figure 1 provides some first evidence. The left panel shows the cross section of unconditional correlations between the returns on Bitcoin (blue bars) or the value-weighted cryptocurrency market portfolio (orange bars) against the returns on each of the 153 equity trading strategies under investigation . The sample period is from November 2014 to December 2021. Returns are calculated daily.
Figure 1: Characteristic-managed equity portfolios vs cryptoasset market
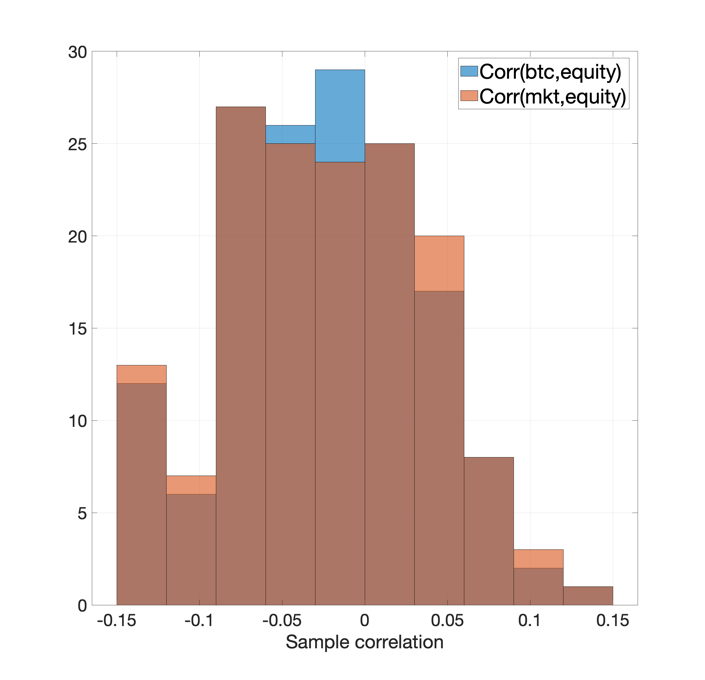
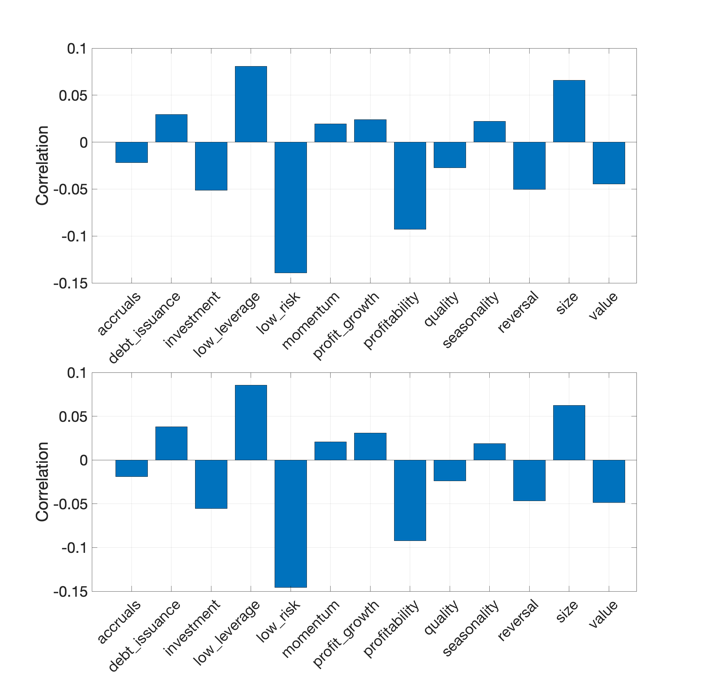
The right panel of Figure 1 shows the same unconditional correlations by clustering groups of equity strategies into so-called risk “themes”, based on the economic rationale of different factor portfolios. For instance, in the momentum cluster are aggregated all the different momentum strategies with different look-back periods and compositions. This provides a more compact picture of the correlation between risk factors in the equity market and both BTC and cryptoasset returns at large.
Two interesting aspects emerge; first, the left panel shows that when looking at a relatively long period of time, that is five years of daily returns, there is no obvious sign of co-movement in the return dynamics of cryptoasset markets vs US equity factors. This is consistent with the conventional wisdom that posits that cryptoassets are segmented from more traditional asset classes and perhaps represent a good diversification opportunity. Second, the right panel shows that this holds when aggregating the factor portfolios in more aggregated risk factors, perhaps with the only marginal exception of a slight negative correlation between cryptoasset returns and the low-risk anomalies.
1The value-weighted market portfolio includes the top 300 cryptoassets sorted by the median market capitalization over the sample period.
Figures 1 and 2 suggest that the spill over effects between cryptoassets and industry portfolios may be time dependent. To delve further into this issue, we compute on a rolling window basis the cross-asset correlations for two different frequencies of observation, that is, daily and monthly returns. The correlation is calculated based on the past six months of returns, meaning 180 trading days for the daily returns and 36 months for the monthly returns. For the ease of exposition, we only focus on a handful of aggregated equity risk factors as per the clustering proposed by Jensen et al. (2022), namely the investment, low leverage, low risk, momentum, profit growth, short-term reversal, size and value factors. Figure 2 reports the time-varying correlation between the value-weighted crypto portfolio returns against these equity factor portfolios.
Figure 2: Rolling window correlations of daily returns
The rolling window correlations perhaps offer a more comprehensive picture. For instance, although the magnitude is still relatively low, the correlation between cryptoasset returns and momentum equity factors tend to increase throughout 2020 and 2021. The opposite holds with respect to low-risk portfolio anomalies, with a correlation of up to -0.3 against cryptoasset returns in 2021. A similar pattern applies to the profit growth factor and the short-term reversal: the correlation between cryptoasset returns and profit growth (reversal and value) factors went negative to positive (from positive to negative) since the early period of 2020. In general, Figure 2 depicts a more interesting picture compared to unconditional correlations in Figure 1. To a large extent, although the correlation between BTC returns and equity risk factors remains relatively low in magnitude, such correlation is not necessarily zero over time and shows some important fluctuations, in particular from 2020 towards the end 2021.
From a purely practical perspective, the fact that cryptoasset markets may be slightly correlated with equity risk factors does not really provide evidence of market integration. Correlation can rise because of correlated trading, common (latent) risk factors and/or aggregate investors preferences and risk aversion (see, e.g., Bianchi and Babiak 2022). In the following, we are going to look at the existence of a more “predictive” relationship between cryptoasset returns and the equity risk factors. In order to look at the inter-temporal correlations between cryptoassets and different industry portfolios we implement a series of predictive regressions. More specifically, we regress the current returns of each equity risk factor on the lagged returns on the crypto market portfolio, and vice versa. The top-left panel of Figure 3 reports the t-statistics corresponding to the partial correlation between the lagged crypto returns and the current equity risk factor returns. The top-right panel reports the corresponding adjusted R2 coefficients. For the ease of exposition, we only focus on the 13 aggregated equity risk factors as per the clustering proposed by Jensen et al. (2022).
Except for the “debt issuance” risk factors, none of the equity strategies seem to be predicted by lagged changes in the cryptoasset market returns. In fact, even for “debt issuance” the in-sample returns predictability is quite low, with an adjusted R2 of 0.3% only. By reversing the predictive relationship between cryptoassets and equity risk factors the picture does not change significantly, that is, none of the equity risk factors seem to carry a significant predictive power with respect to the one-day ahead cryptoasset returns.
Figure 3: Lead-lag effects of equity portfolios vs cryptoasset returns
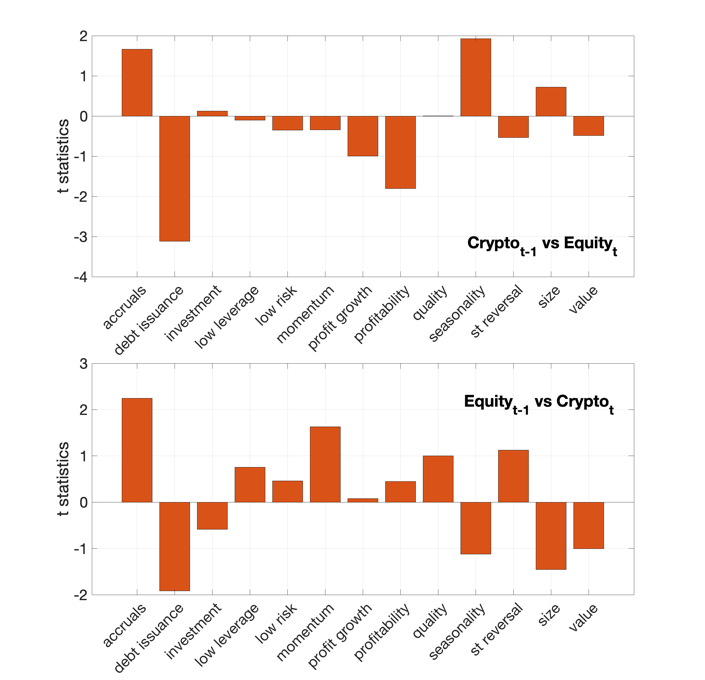

None of the t-statistics are convincingly significant at conventional statistical thresholds. In addition, the adjusted R2s are rather dismal throughout equity factors. Put differently, Figure 3 seems to suggest that there is no lead-lag relationship between equity risk factors and the aggregate returns on the cryptoasset market.
Evidence from Fama-French equity risk factors
In addition to these characteristic-managed portfolios we now expand the previous correlation analysis by looking at five additional equity risk factors as per Fama and French (2015) (henceforth Fama-French factors). These include the returns on a value-weighted equity market portfolio in excess of the risk-free rate, in addition to conventional size (SMB), value (HML), profitability (RMW) and investment (CMA) portfolios. The reason why we expand to these risk factors is twofold: first, the time series of Fama-French factors includes risk factors returns until the end of 2022, while the returns on the factor portfolios from Jensen et al. (2022) ends in 2021. This gives almost a full year into the so-called post-COVID period. Second, the Fama-French five factor model originally proposed by Fama and French (2015) is one of the benchmark models to understand risk factors within the context of equity markets (see, e.g., Fama and French 2016). As for the large cross section of equity strategies, we first look at the unconditional correlations based on daily returns.
Figure 5: Conventional equity risk factors vs cryptoasset market
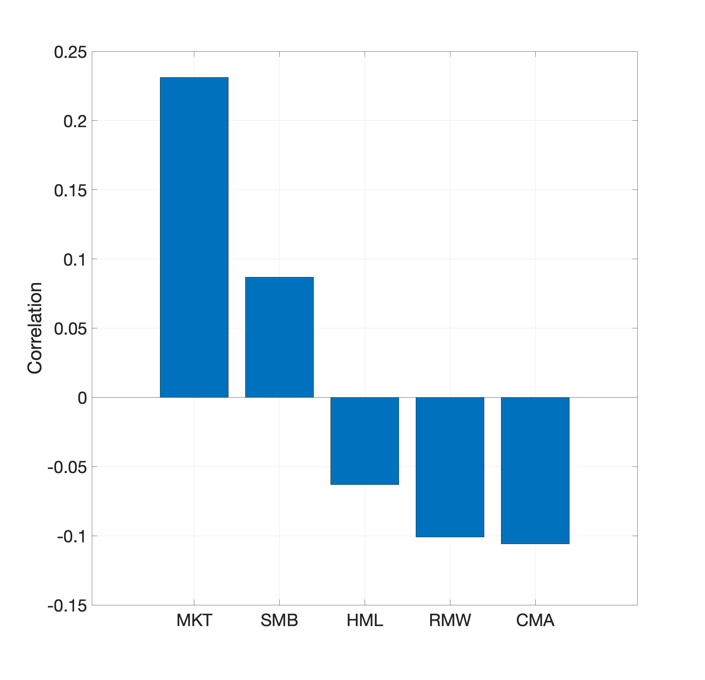
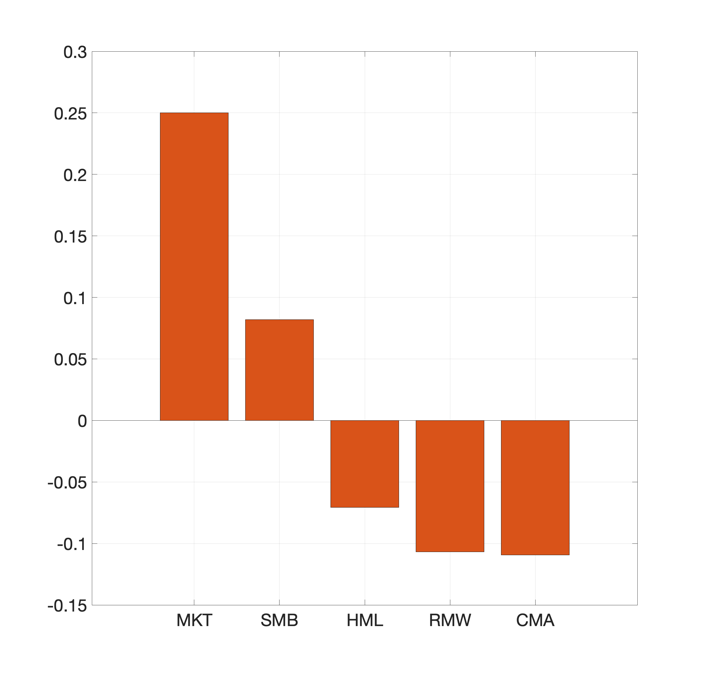
Figure 5 shows the correlations between the returns on Bitcoin (blue bars) and a value-weighted crypto market portfolio (orange bars). As for the largest cross section of factor portfolios, there is only a mild correlation between cryptoasset returns and the Fama-French factors over the full sample of returns. Perhaps unexpectedly, the correlation between the equity market portfolio and cryptoasset returns is well above 0.2 over the full sample.
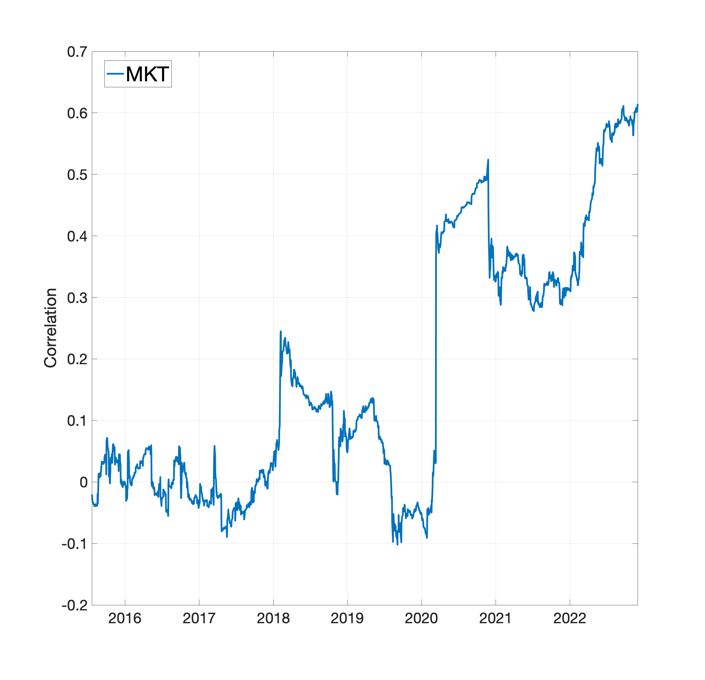
Figure 6 shows that this is primarily driven by an increase in the correlation between the equity and the cryptoasset market since the early 2020. The figure shows the conditional correlation between the equity market risk factor and the returns on the value-weighted cryptoasset portfolio returns. Perhaps not unexpectedly, such correlation is as high as 0.6 towards the end of 2022. Recall this measure is based on a 180-rolling window of daily returns.
Figure 6: Rolling window correlations of daily returns and Fama-French factors
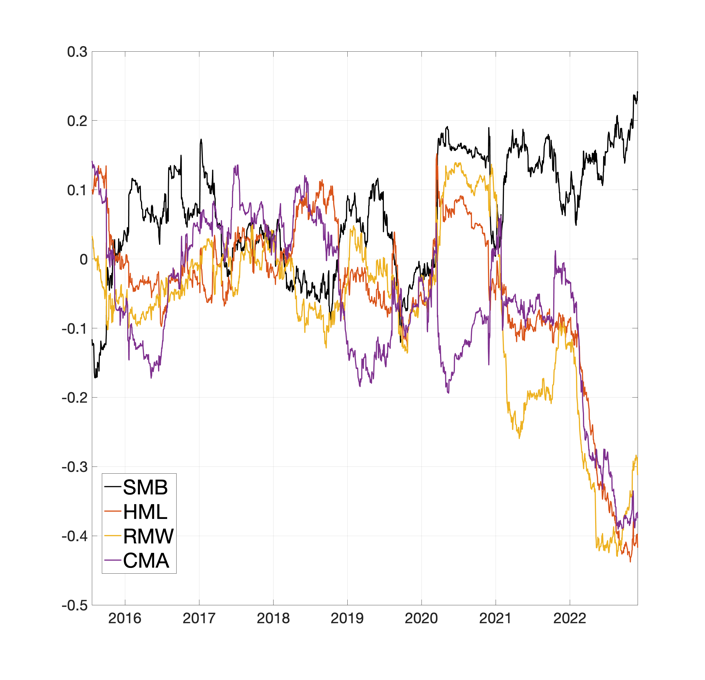
Even more interesting are the rolling window correlations between the value-weighted cryptoasset portfolio and the conventional Fama-French risk factors. The evidence points towards an increasing correlation. Specifically, the correlation between cryptoasset returns and some of the conventional equity risk factors, such as value, profitability, and investment become increasingly negative towards the end of 2022. This does not necessarily suggest that there is increasing market integration, or that the two markets share fundamental risk factors, but is certainly initial evidence which could require further investigation to fully understand the diversification benefits that are typically attached to cryptoasset markets.
Discussion
The presence of correlation between cryptoassets and equity risk factors have constantly been debated by commentators and market participants. On the one hand, the absence of cross-asset contemporaneous correlations may suggest the pricing mechanism of cryptoassets is still not fully understood. On the other hand, this may be ultimately beneficial for investors and market participants as it possibly carries significant diversification benefits.
In this report, we implement an extended correlation analysis on a comprehensive set of equity risk factors and show mixed evidence as far as returns spill overs are concerned. When looking at the full history of observations, the correlation remains quite low, in the range of -0.2 to 0.25, depending on the risk factors. However, dynamic correlations suggest that at times the correlation between the returns on cryptoasset markets and equity can be non-zero and potentially economic significant, especially within of conventional equity risk factors, such as value, profitability and investment, as originally proposed by Fama and French (2015). Perhaps less unexpected is the increasing correlation between the equity market portfolio and cryptoasset returns, which shows a conditional correlation as high as 0.6 towards the end of the sample.
This result possibly has important implications in our understanding of the time-dependent relationship between cryptoassets and traditional equity. The bottom-line is that equity risk factors, as captured by conventional factor portfolios, potentially have an increasing correlation with the dynamics of the returns in cryptoasset markets. If this correlation is simply the result of correlated trading, aggregate risk aversion, or there are some shared economic fundamentals is a different question which cannot be fully answered based on simple correlation analysis.
Bibliography
T. I. Jensen, B. T. Kelly, and L. H. Pedersen. “Is there a replication crisis in Finance?” Journal of Finance, (Forthcoming), 2022
Bianchi, D, and M. Babiak. “A risk-based explanation of cryptocurrency returns”, Working Paper (2022).
Fama, Eugene F., and Kenneth R. French. "A five-factor asset pricing model." Journal of financial economics 116.1 (2015): 1-22.
Fama, Eugene F., and Kenneth R. French. "Dissecting anomalies with a five-factor model." The Review of Financial Studies 29.1 (2016): 69-103.
Disclaimer