Introduction
Conventional wisdom suggests that investors should be compensated for their exposure to risk. This holds for any type of risky investment, from equities to commodities. Cryptoassets are no exception. At the time of writing, there are more than 13,300 cryptoassets, with a total market capitalisation of more than $2.5 trillion.1 As such, understanding the dynamics of risk and reward is becoming particularly pressing for investors, policy makers and researchers at large.
The most common empirical approach to evaluate the trade-off between risk and return is based on the idea that the cross-sectional variation in the returns of individual assets can be reduced to few factors, which approximate the sources of systematic risks individual assets are exposed to. These factors can be considered either observable, and typically proxied by long-short portfolios2, or latent and the result of some data compression technique such as Principal Component Analysis (PCA).3,4
Both approaches are problematic in the context of cryptoasset markets. For starters, the high market concentration and low liquidity makes the construction of standard long-short portfolios as observable proxies of the sources of systematic risk particularly problematic. Figure 1 below illustrates this case in point.
Figure 1: Concentration and Supply Held On Exchanges
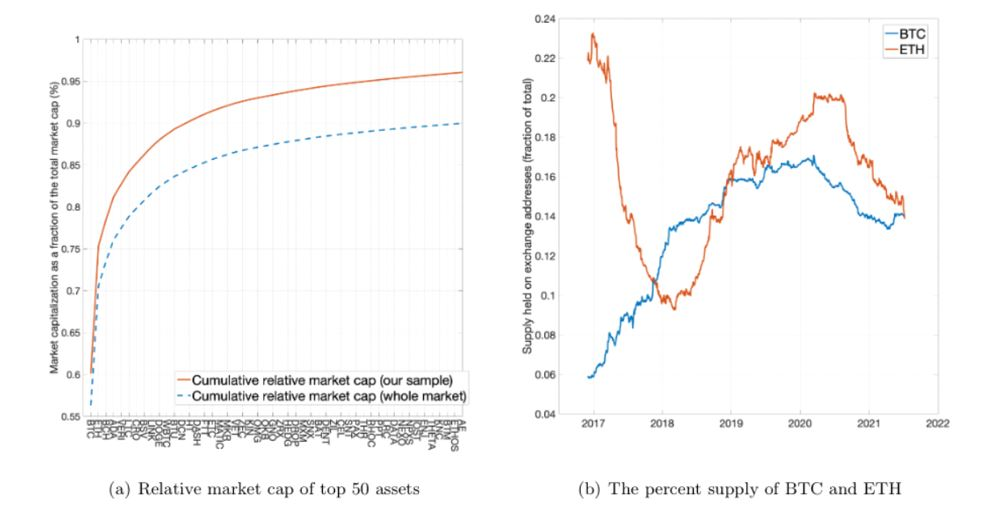
Two interesting facts emerge. First, the top 50 cryptoassets account for roughly 90% of total market capitalisation. This means cryptoassets beyond top 100 are essentially micro-caps, with all sorts of issues in terms of trading costs, liquidity and frictions. Second, the top right panel shows that even for some of the largest cryptoassets currently available, bitcoin and Ether, only a small fraction of the supply is readily tradable on relatively liquid crypto exchanges such as Binance, Bitfinex, Coinbase and Poloniex. Such high market concentration and low liquidity is problematic from an operational standpoint and during the construction of reliable proxies of systematic risk factors using observable long-short portfolios. Similarly, the high concentration limits the use of standard data compression methods such as PCA.
Dr Daniele Bianchi (Queen Mary, University of London) and Mykola Babiak (Lancaster University Management School) take a different approach and investigate the dynamics of risk and reward for a large number of individual cryptoassets through the lens of an Instrumented Principal Component Analysis (IPCA), as recently proposed by Kelly et. Al (2019).5 In their recent paper “A Factor Model for Cryptocurrency Returns”, they disentangle the relevant sources of risk which are reflected in the dynamics of individual cryptoasset returns.
Asset Pricing
The main empirical analysis is based on daily market and blockchain observations for 809 cryptoassets over the period from December 2nd 2016 to July 9th 2021. The sample excludes stablecoins, which are directly pegged to fiat currencies and therefore do not respond to systematic risks.
From a pure empirical asset pricing perspective, the main results are twofold:
1. First, the main driving factors of expected returns in cryptoasset markets are liquidity, size, downside risk and exposure to the aggregate market trend.
2. Second, a parsimonious model which explicitly acknowledges the unknown structure of cryptocurrency returns is more accurate in capturing the risk-return trade-off within the context of mean-variance investing.
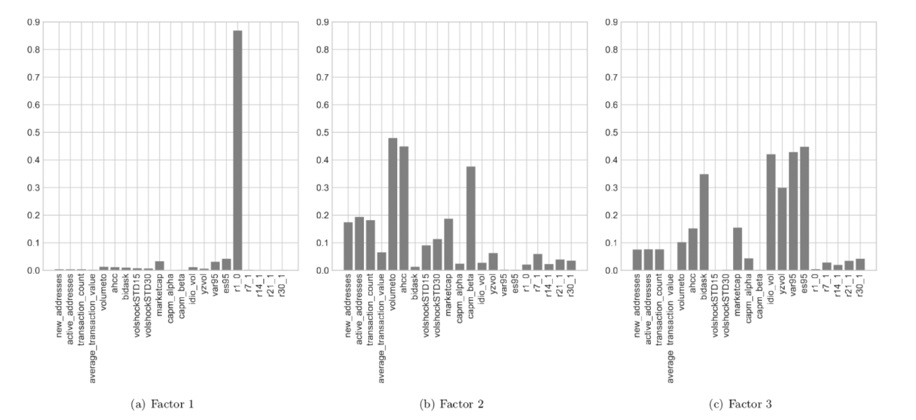
Figure 2 below gives a sense of the main characteristics that drives the dynamics of the IPCA loadings and therefore of the conditional expected returns on individual assets. More specifically, the figure reports the R^2 of a regression in which the dependent variable is a given factor and the independent variable is a given characteristic-based portfolio. A few interesting factors emerge. The first factor is primarily linked to short-term reversal. As short-term reversal is inherently linked to liquidity and we can assume that the risk of ”evaporating liquidity'' in the short term may indeed represent a significant source of risk for investors in cryptoasset markets, for which they may require significant compensation.6,7 The second factor is primarily linked to aggregate market activity, proxied by average trading volume and the Amihud (2012)’s illiquidity ratio, as well as the exposure to the aggregate crypto market trend, i.e., the equivalent of a CAPM beta.8 The third factor primarily correlates with both returns volatility and downside risk, proxied by the historical Value-at-Risk and Expected Shortfall. To summarise, the IPCA factors are related to conventional sources of risks, which fit the nature of cryptoasset markets, such as liquidity, size, and the exposure to aggregate market and downside risk.
Figure 2: Correlation Between the IPCA Latent Factors and Asset Characteristics
Unconditional Mean-variance Efficiency
The results so far highlight that the dynamics of risk and reward in cryptoasset markets are primarily linked to liquidity, size, market beta and volatility / downside risk. These sources of systematic risk are the ones behind the model-implied dynamics of expected cryptoasset returns. This, of course, works under the assumption that the model is somewhat well-specified. An accurate in-sample description of the risk-rewards of individual assets implies that a given model should be mean-variance efficient in an unconditional sense. That is, the factors extracted from the model should be able to price assets unconditionally, meaning the pricing error is not significant once these factors are considered. A simple test would be to investigate the pricing ability of the IPCA model for a set of characteristic-based portfolios; long-short portfolios constructed based on a given set of individual asset characteristics.
Figure 3 below shows the results. We compare the alphas obtained from the IPCA model with three latent factors (right panel) against a typical factor model with six observable risk factors: market, liquidity, volatility, reversal, momentum and size (left panel). The alphas are obtained by regressing the returns on a set of characteristic-based portfolios on the three latent factors from the IPCA (right panel) or the six observable long-short portfolios (left panel). For the ease of interpretation, we highlighted in black the alphas which are significantly different from zero. We study the cross section of managed portfolios, as these represent test portfolios that are weighted by asset characteristics. More details on portfolio construction and asset characteristics can be found in Bianchi and Babiak (2021).9
Figure 3: Unconditional Mean-variance Efficiency
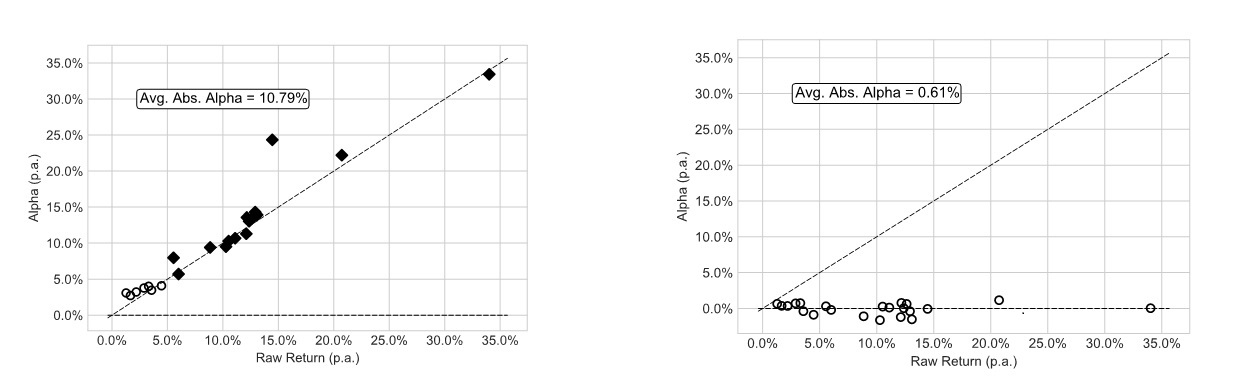
Clearly, by allowing conditional expected returns to directly depend on individual asset characteristics, such as liquidity, market, size, and downside risk, asset pricing performance improves substantially compared to a standard factor pricing model. The average absolute pricing error decreases to a non-significant 0.61% annualised, against an annual 10.8% obtained by using observable risk factors.
Concluding Remarks
As a whole, this research contributes to a better understanding of the interplay between risk and reward within the context of cryptoasset markets. The results show that a low-dimensional factor structure (compared to the number of assets) driven by size, liquidity, market beta and downside risk explains a great deal of variation in the dynamics of cryptoasset returns. These findings are confirmed both in-sample and out-of-sample, as well as by using weekly returns observations.
The paper is available online here
References
Eugene, Fama, and Kenneth French. "The cross-section of expected stock returns." Journal of Finance 47.2 (1992): 427-465.
Footnotes
1 Coinmarketcap, see https://coinmarketcap.com/
2 Fama, E. F. and French, K. R. (2015). A five-factor asset pricing model. Journal of Financial Economics, 116(1):1–22
3 Chamberlain, G. and Rothschild, M. (1983). Arbitrage, factor structure, and mean-variance analysis on large asset markets. Econometrica (pre-1986), 51(5):1281
4 Connor, G. and Korajczyk, R. A. (1986). Performance measurement with the arbitrage pricing theory: A new framework for analysis. Journal of Financial Economics, 15(3):373–394
5 Kelly, B. T., Pruitt, S., and Su, Y. (2019). Characteristics are covariances: A unified model of risk and return. Journal of Financial Economics, 134(3):501–524.
6 Nagel, S. (2012). Evaporating liquidity. The Review of Financial Studies, 25(7):2005–2039.
7 Bianchi, D. and Dickerson, A. (2020). Trading volume in cryptocurrency markets. Working Paper.
8 Amihud, Y. (2002). Illiquidity and stock returns: cross-section and time-series effects. Journal of financial markets, 5(1):31–56.
9 Bianchi, D. and Babiak, M. (2021). A Factor model for cryptocurrency returns. Working paper.
Disclaimer