The creation of thousands of cryptoassets has spurred the interest of financial practitioners in this innovative and rapidly evolving market. From the perspective of portfolio managers, the key area of discussion is whether this asset class is effectively segmented from more traditional asset classes, such as equities, bonds, commodities and currencies. The implication of cryptoassets being separated from more traditional investments implies that they may offer considerable and persistent diversification benefits, something that we investigate further in this note.
Note that a diversified portfolio contains a mix of distinct asset types and investment vehicles, limiting exposure to any single asset or risk. The rationale behind this is that a portfolio constructed of different kinds of assets will, on average, yield a superior risk-return profile.
Correlations
A key prerequisite for an asset to bring some diversification benefit is that it should have low correlation relative to other assets in a portfolio.
Although there is not much historical information about cryptoasset markets in general, one can look at the correlation between bitcoin (BTC) and other asset classes to have a rough idea of the correlation between cryptoassets and other, more traditional forms of investment.1
Figure 1: Correlation of traditional asset classes vs bitcoin
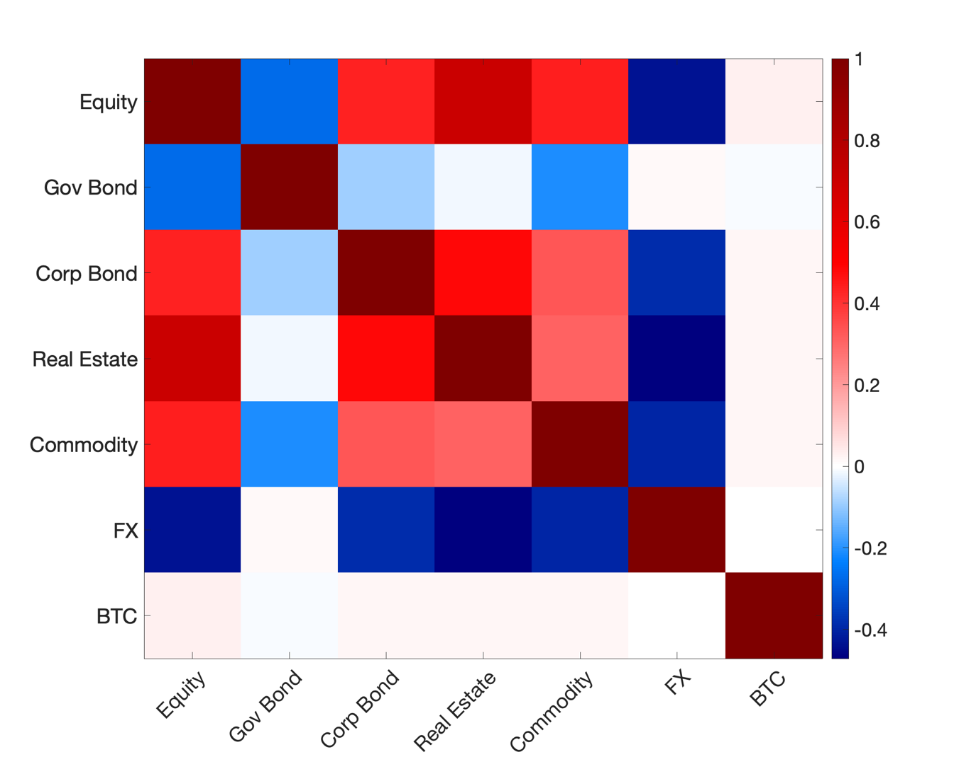
Figure 1 plots unconditional correlations between traditional asset classes and BTC. Two interesting facts emerge. First, there is a considerable amount of correlation among standard asset classes. For instance, the correlation between commodities and equities, and REITs and equities, is as high as 0.7. Also, the correlation between bonds and equities is negative and significant. Second, and more importantly, there is virtually no correlation between BTC and traditional asset classes. As a matter of fact, the correlation coefficient between BTC and all other asset classes is practically zero.
Figure 2 shows a more dynamic picture of correlations. We report rolling 24-month correlations between BTC vs other asset classes based on daily returns.
Figure 2: Time-varying correlation between bitcoin and other asset classes
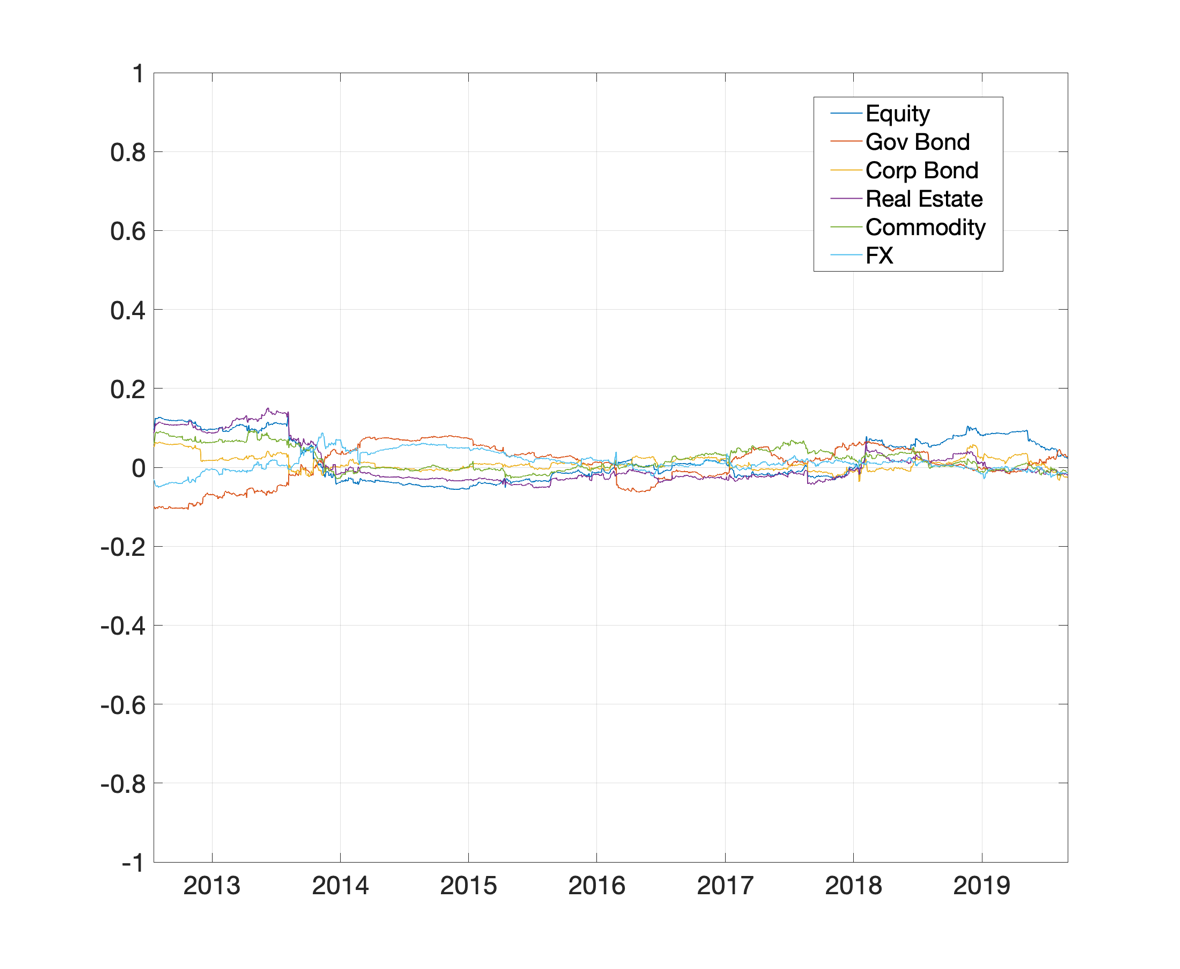
The figure makes clear that, despite fluctuations over time, the correlation between BTC and traditional asset classes is virtually non-existent. This lends support for the use of BTC for diversification, and thus to potentially enhance risk-adjusted returns.
Returns
To illustrate the return potential of cryptoassets in comparison with traditional asset classes, we show average realised daily returns for the sample between July 2010 and January 2020.
Figure 3: Average returns of traditional asset classes vs bitcoin
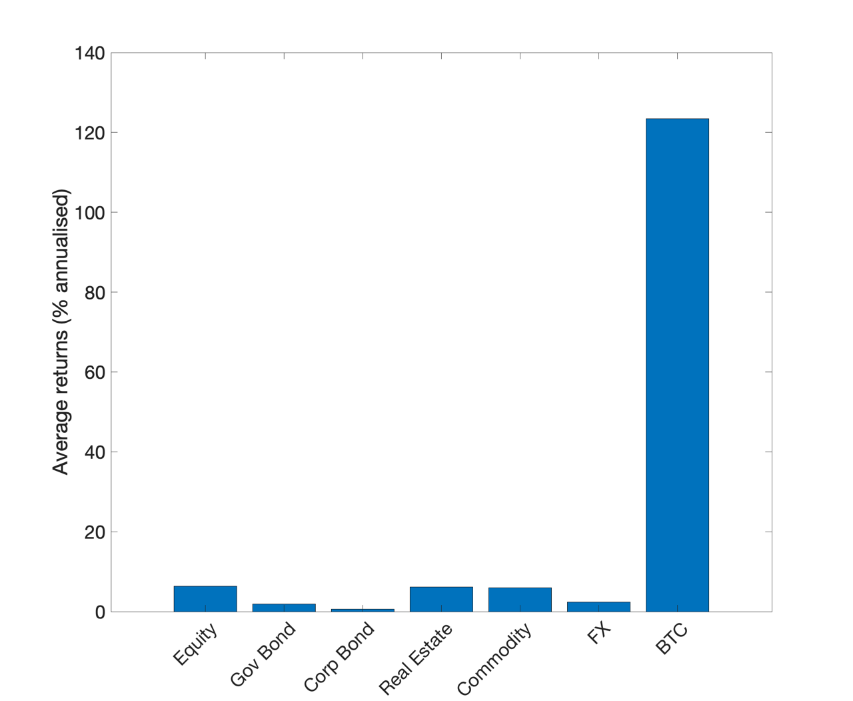
Figure 3 shows clearly that BTC returns have been orders of magnitude larger than the returns on traditional asset classes. For instance, the annualised return on BTC is more than twenty times higher than the return on equities.
Risk / Volatility
The higher returns offered by cryptoassets are known to be accompanied with higher volatility. Figure 4 shows the daily unconditional standard deviations of the same traditional asset classes vis a vis BTC over the same time period, i.e. from July 2010 to January 2020.
Figure 4: Average volatility of traditional asset classes vs bitcoin
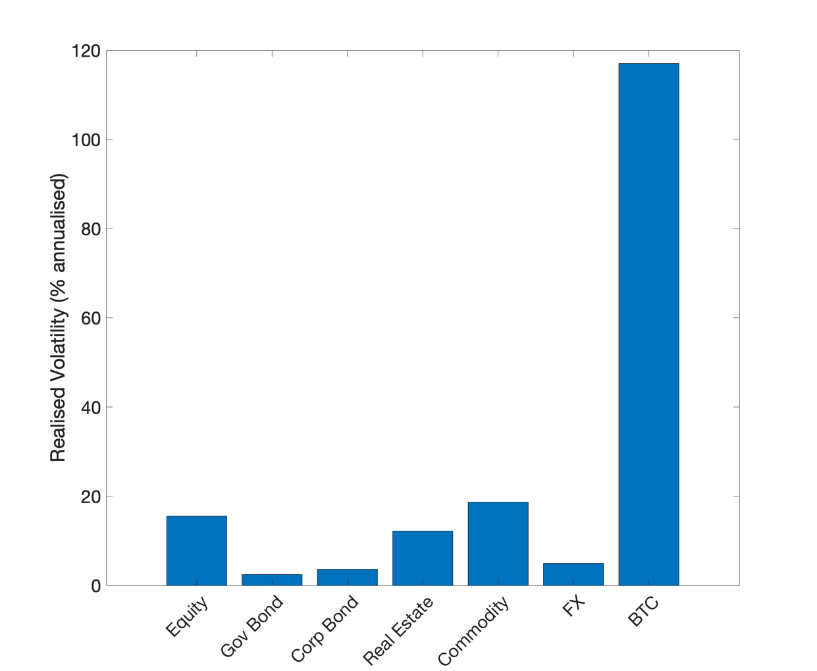
By looking at the unconditional standard deviation of the returns, two interesting facts emerge. First, the volatility of traditional asset classes is quite comparable, with commodities turning out to be only slightly more volatile all other investments. Second, similar to returns, the volatility of BTC is orders of magnitude higher than the other asset classes, reinforcing the conventional wisdom that higher returns are accompanied by higher risk.
Risk-adjusted Returns
Of course, in order to understand the diversification properties of cryptoassets, it is not constructive to simply consider raw returns and volatility statistics. The fact that cryptoassets deliver higher returns with higher volatility naturally raises the question of whether they can still outperform relative to traditional asset classes in risk-adjusted terms.
Figure 5 reports the Sharpe ratios of both traditional asset classes as well as BTC. The sample runs from July 2010 to January 2020.
Figure 5: Sharpe ratios of traditional asset classes vs bitcoin
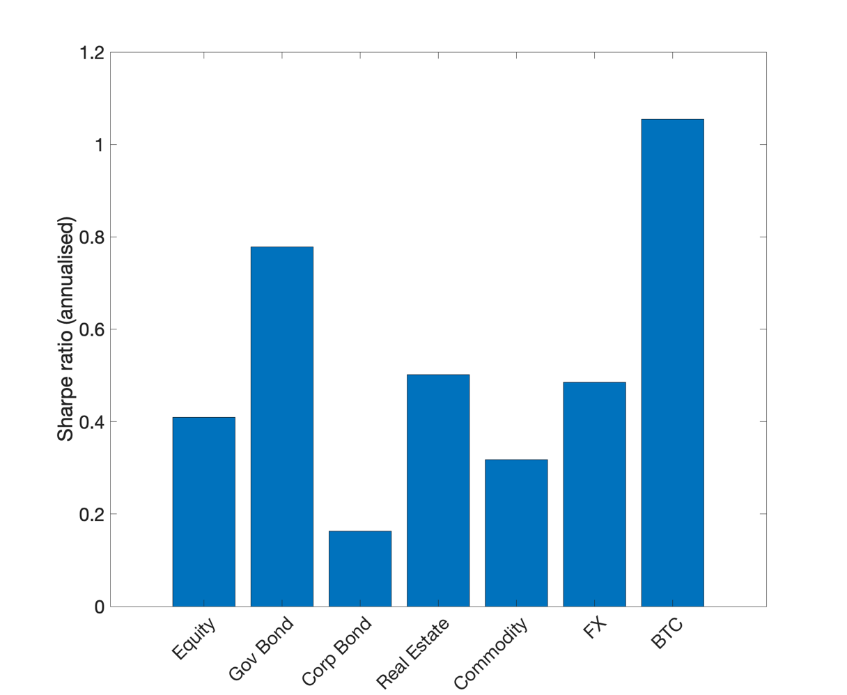
Recall that the Sharpe ratio measures returns per unit of risk, as proxied by the unconditional standard deviation of the returns. It is evident that, once taking into consideration risk, the returns on BTC become more comparable with traditional asset classes. Nevertheless, the Sharpe ratio is still almost double, on an annual basis, compared to equities or the US dollar. This, coupled with negligible correlations as outlined in Figure 1, suggests that, indeed, cryptoassets may provide some benefit to improve the risk-return profile of a portfolio invested in traditional assets.
Figure 5 gives a static picture of the risk-adjusted returns across both traditional asset classes and BTC. A much more useful interpretation of the pros and cons of cryptoasset investments is given by looking at the dynamic risk-adjusted returns, that is, how BTC compares against other asset classes over time. Figure 6 shows average 12 month rolling Sharpe ratios of both traditional investments and BTC. For the ease of exposition, we report the results only for four traditional asset classes - equities, corporate bonds, commodities and REITs. The sample period remains from July 2010 to January 2020.
Figure 6: Rolling Sharpe ratios of traditional asset classes vs bitcoin
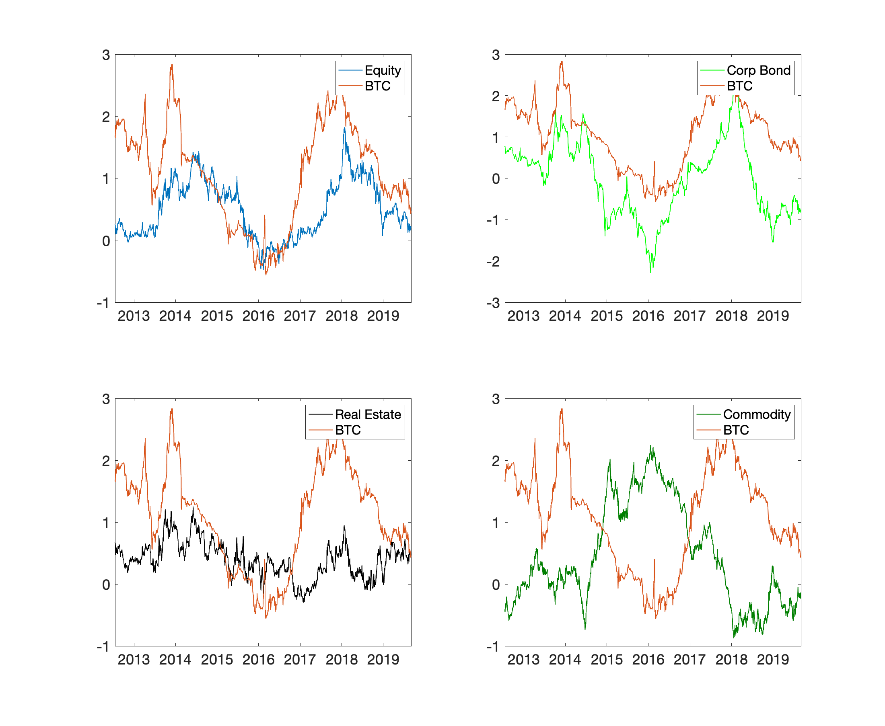
Two interesting facts emerge. First, BTC generally compares favourably over time against traditional asset classes in terms of risk-adjusted returns. As a matter of fact, until January 2019, an investment in BTC delivers a higher risk-adjusted return than all of the other investments considered. Second, there is somewhat a common trajectory between BTC and equity markets. That is, there is evidence of some sort of correlation of risk-adjusted returns.
Portfolio Diversification Benefits of Cryptoassets
In addition to standalone analysis of Sharpe ratios, we also model a more practical exercise in order to assess the full diversification benefits of using cryptoassets.
Consider an investor with typical mean-variance preferences, i.e. one who aims to maximize returns subject to a minimal level of risk. The investment menu is the same as above, that is the investor can optimally choose between equities, bonds (both government and corporate), commodities, REITs and the US dollar. In addition, let us consider an alternative portfolio in which cryptoassets are also considered together with traditional asset classes.
Figure 7 reports the risk-return profile of a portfolio without BTC, a portfolio with BTC, and each of the traditional asset classes separately.
Figure 7: Risk-return profile of a portfolio with and without bitcoin

Two interesting facts emerge. First, as expected, a diversified portfolio (without crypto) delivers significantly lower risk vs investing in each of the single assets. Second, including BTC in the investment menu significantly improves the returns on the portfolio, while keeping risk below any other asset class taken alone with the only exception of government bonds. Importantly, an expanded portfolio that includes BTC deliver a significant and positive return, even when adjusted for risk.
A clearer way to illustrate this is by looking at the Sharpe ratios of portfolios with and without BTC. Figure 8 shows the annualised Sharpe ratio assuming a standard fees structure of 2% management fees 20% performance fees.
Figure 8: Sharpe ratios of portfolio with and without Bitcoin
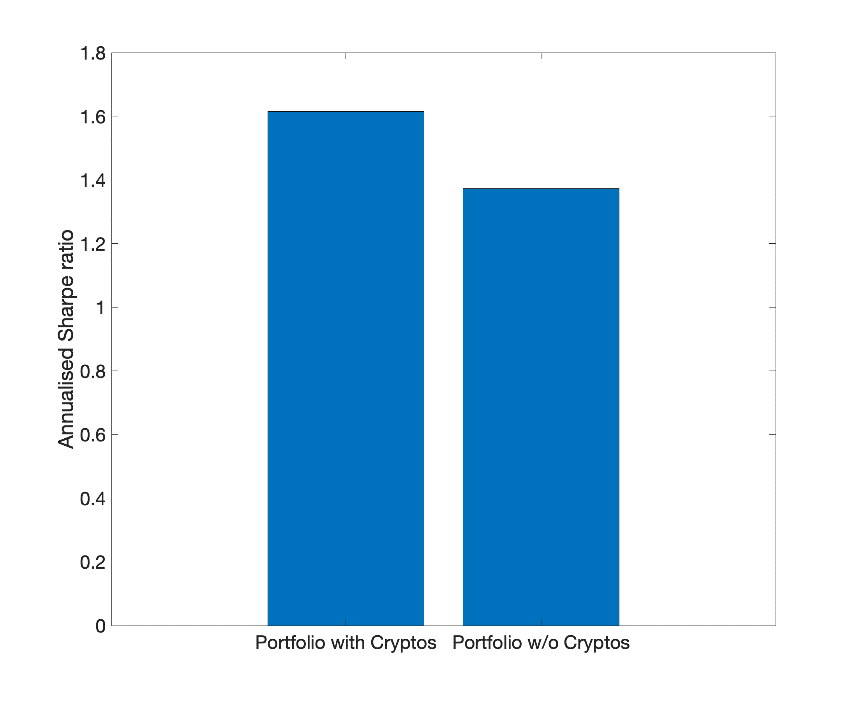
Figure 8 suggests that including BTC significantly improves risk-adjusted returns relative to an otherwise traditional mean-variance optimal portfolio. Notice that both calculations do not take into account transaction costs or liquidity risk. Based on this analysis, having a fraction of a portfolio in cryptoassets may be a sensible way to improve returns without taking on too much additional risk.
Note that, to reach this result, the fraction of wealth invested in cryptoassets does not have to be too large. Figure 9 illustrates this case in point, by showing the fraction of wealth invested in each of the asset classes behind the unconditional Sharpe ratios above.
Figure 9: Optimal portfolio weights
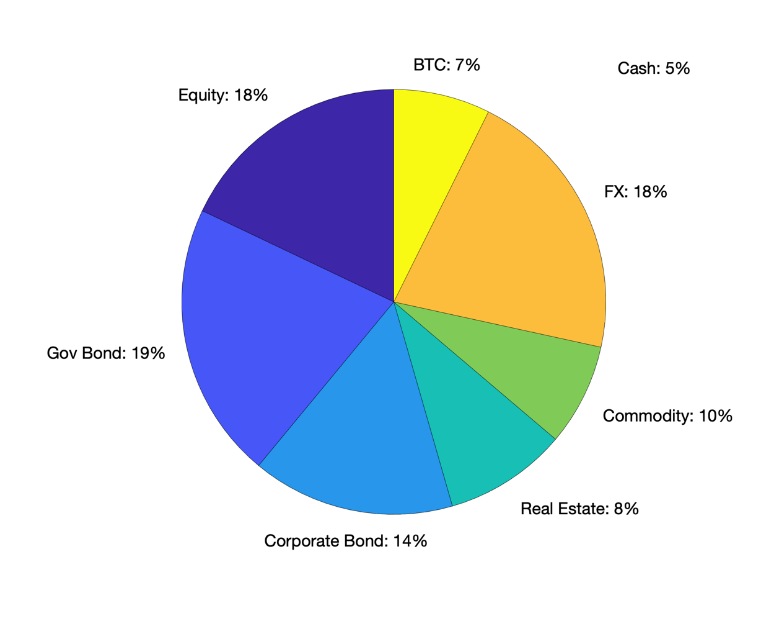
Assuming the fraction of wealth that is kept in cash is 5% of total investment, Figure 9 shows that merely 7% of the total investment should be invested in BTC to reach the results in Figures 7 and 8. Interestingly, given the high volatility amongst all of the asset classes, a good chunk of wealth is invested in FX and Government bonds. This is consistent with the results in Figure 4 whereby both these asset classes show a quite sizable Sharpe ratio, second only to BTC.
Final Remarks
Overall, the analysis above suggests that the combined characteristics of negligible correlations and high risk-adjusted returns presents a strong case for the addition of cryptoassets in an investment portfolio.
However, it goes without saying that diversification should be investigated more carefully, perhaps in the context of more complex dynamic investment strategies and considering transaction costs and liquidity issues. Analysis across different time periods may also indeed yield slightly different results. Note that the analysis presented above on portfolio optimisations is also subject to many assumptions that serve only as approximations. In real-life scenarios, weightings may differ depending on market conditions, such as aggregate volatility and liquidity. Nevertheless, the results clearly suggest that by including BTC (or cryptoassets generally) in the pool of possible investments, the risk-return trade-off of a representative portfolio substantially improves.
Footnotes
1 Note that BTC since 2010 has represented, on average, more than 75% of the overall cryptocurrency market. As a result, one can consider BTC as representative of the market trend without loss of generality.