The price of a bitcoin (BTC) against major fiat currencies has increased exponentially over the last decade, despite its high volatility and widely-documented boom and bust in late 2017 – early 2018. Investors may employ different strategies to profit from the fluctuating price of BTC, typically relying on signals which give an idea of whether or not market prices are consistent with fundamental values.
One of the main tools to capture and understand Bitcoin valuations are the so-called on-chain metrics. Although largely experimental, on-chain metrics make use of data generated on the Bitcoin network, with prices, volume, fees, etc. as inputs. Because of the diverse nature on the information used, on-chain metrics can be quite and broad. Nevertheless, they can be very useful, particularly when analysing the state of market cycles.
In this research note, we investigate some interesting ways to use on-chain metrics to build successful trading signals. We outline indicators aimed at capturing specific on-chain metrics and back-test their performance against a standard buy-and-hold trading strategy. The final goal is to assess the economic significance, if any, of on-chain-based trading signals.
Indicators based on transaction value
Transaction (TX) value is the amount of on-chain transactions expressed in USD, adjusted for coins that have been generated but not yet entered into circulation. The largest portion of non-circulating coins are held by the creator of bitcoin, Satoshi Nakamoto. To some extent, it represents the equivalent of what sales/revenue/turnover is for a traditional equity analyst. We consider a variety of moving average combinations for the short- and the long-term and generate a trading signal for each of those. More specifically, we consider 1, 2, 3, 5, 12, 26, and 52-week moving averages for the TX Value in US dollars. The trading signal is constructed as follows: when the short-term moving average is greater than the longer-term moving average, it generates a bull signal and vice-versa.
Figure 1: A first indicator based on on-chain transaction value
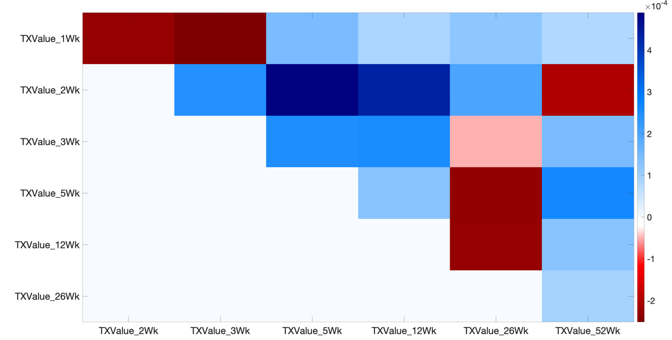
Figure 1 shows the unconditional average returns in excess of a simple buy-and-hold strategy for each of the moving average combinations used to create a signal. Notice that the dark-blue (dark-red) cells indicate higher (lower) excess returns.
Two interesting facts emerge. First, the vast majority of strategies generate positive returns in excess to BTC. Second, a short-term window of 2-week crossed with a medium-term window of 12-week seems to generate the highest average performance. This shows that on-chain transaction value may have a meaningful information content when it comes to design a trading indicator.
Now we back-test such a strategy (2-week vs 12-week MA) by looking at the cumulative returns generated in excess of the BTC buy-and-hold. Figure 2 shows the results.
Figure 2: Back-testing the TX Value strategy
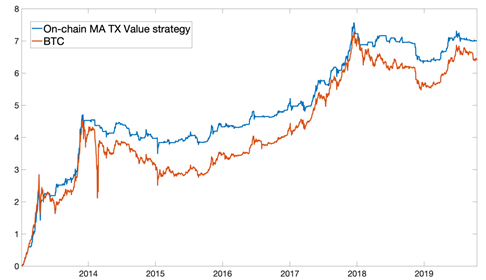
The strategy based on the two moving averages outperforms a simple BTC buy-and-hold, though by a small margin. Nevertheless, it seems that the information contained in the TX Value has some economic significance, especially when short- and medium-term averages are combined.
Indicators based on the net-value-to-transactions ratio
The Network-Value-to-Transactions (NVT) ratio measures the dollar value of on-chain transaction activity of a given cryptocurrency network relative to its network value. More precisely, NVT is calculated as the Network Value (total dollar USD value of all the circulating units of a given crypto asset, which is equivalent to the market capitalisation of a stock) dividend by the On-chain Transaction Activity (dollar value of the transactions settled on the crypto asset’s blockchain).
Several recipes exist in terms of constructing trading signals based on NVT. For instance, one strategy is to set both lower and upper thresholds of NVT values such that, once crossed, these signal that BTC is either overbought or oversold. This is very much in the spirit of traditional technical indicators such as the Relative Strength Index (RSI) and the Moving Average Convergence Divergence (MACD).
Similar to the TX Value above, we consider a variety of moving average combinations for the short- and the long-term and generate a trading signal for each of those. More specifically, we consider 1, 2, 3, 5, 12, 26, and 52-week moving averages for the NVT expressed in US dollars. Figure 3 shows the results.
Figure 3: A second indicator based on NVT
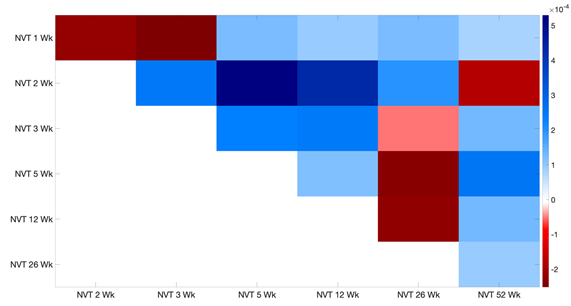
Figure 3 makes a strong case for using the NVT via a carefully calibrated strategy based on moving averages. Again, short-term and a medium-term moving averages crossing each other seems to generate the best returns.
We now formally back-test the pair 2- vs. 5-week moving averages against a buy-and-hold investment in BTC. Similar to the TX Value, we consider as a benchmark a simple buy-and-hold strategy on BTC. Figure 4 shows the results.
Figure 4: Back-testing the NVT trading strategy
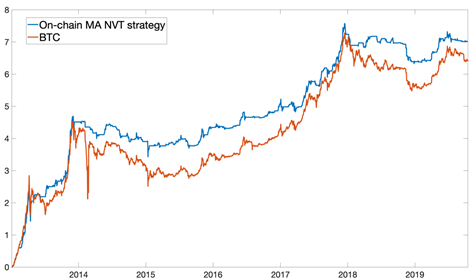
Two interesting facts emerge. First, there are periods where the cumulative returns from the NVT-based strategy are essentially equivalent to the ones generated from a simple buy-and-hold (e.g. early 2014 and late 2017). These are period of high market volatility. Second, the best performing strategy based on NVT still generates only marginal outperformance with respect to BTC, with less than 100 basis points excess returns by the end of the sample.
These results show that, despite being theoretically linked to the true value of the BTC network, the NVT does not generate economically significant trading signals over time, at least for the sample under investigation. One possible reason lies in the fact that the NVT does have several limitations. For example, it does not take into account trading that is executed on exchanges. The dollar amount traded on exchanges tends to be larger than the dollar value of on-chain transactions. As a result, NVT does not take into account short-term fluctuations due to speculative pressures. This may be outside the “value proposition” of NVT, but is a relevant aspect that should be considered when designing trading algorithms.
Indicators based on BTC prices
We now turn our attention to a standard indicator based on BTC prices - two simple moving averages calculated at different frequencies as above. Although this is perhaps the most simple indicator one can think of, it has been proved effective in the finance profession when it comes to construct trend-following trading strategies. As before, we start by looking at different moving average combinations for the short-term and the long-term components. Figure 5 shows the results.
Figure 5: A third indicator based on BTC prices
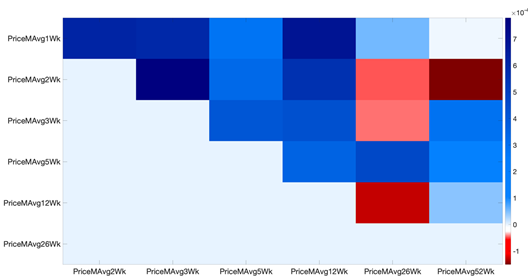
The figure makes the case for the use of past prices as trading signal. The combination of two short-term – the 2-week and 3-week - moving averages seems to deliver the best results. Figure 6 shows the back-testing of such a strategy against a buy-and-hold on BTC.
Figure 6: Back-testing the BTC price trading strategy
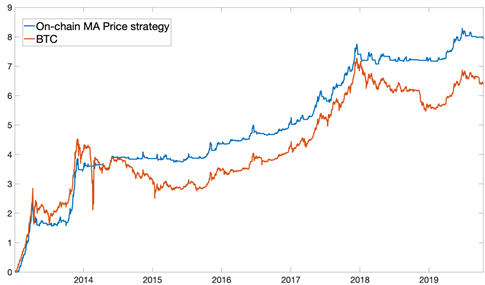
Interestingly, using simple moving averages of past prices seems to dominate the performance achieved via TX Value and the NVT. A simple calculation at the end of the sample shows that investing in this strategy would deliver eight dollars at the end of the sample against seven dollars by using the TX value or the NVT as on-chain signals.
Indicators based on on-chain transaction fees
Transaction fees are included with bitcoin transactions in order to incentivise miners. The space available for transactions in a block is currently artificially limited in the Bitcoin network. This means that to get transactions processed quickly, participants have to outbid other users.
As above, we first look at the cross-pair performance of different moving averages that are combined to anticipate and track market trends. Figure 7 shows the results.
Figure 7: A fourth indicator based on on-chain fees
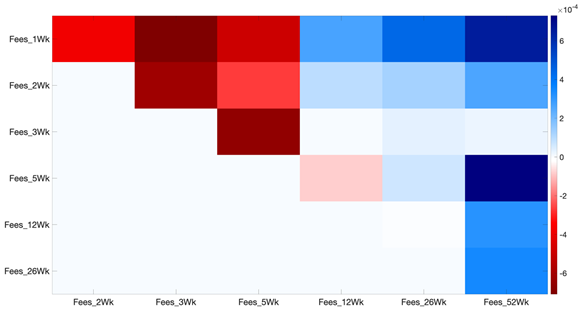
Two interesting facts emerge. First, unlike the other indicators, information on the long-term matters much more. As a matter of fact, the best performing pair of moving averages involves the calculation of the 52-week average to capture lower frequency changes in the fees. Figure 8 formally back-tests such a strategy against a buy-and-hold for BTC.
Figure 8: Back-testing the BTC fees trading strategy
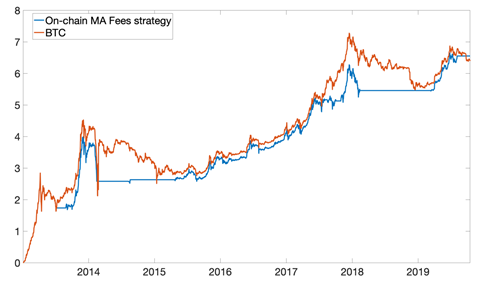
Interestingly, a formal back test seems to reject the idea that one can use fees information as a viable way to obtain a meaningful trading signal. As a matter of fact, the cumulative returns on the unconditional best performing moving average pair seems to under-perform the BTC buy-and-hold benchmark.
Indicators based on inventories
Inventory is the total value of coins that were generated but never distributed. Coins that move from inventory into circulation are observed through when they were first spent. The baseline hypothesis of using inventory as a possible trading signal is that scarcity, as measured by BTC generated but never distributed, directly drives value. Figure 9 reports the cross-pair performance of different moving averages that are combined to anticipate and track market trends. A look at the main results show that market values tend to be higher when short-term inventories are higher than longer term inventories.
Figure 9: A fifth indicator based on inventories
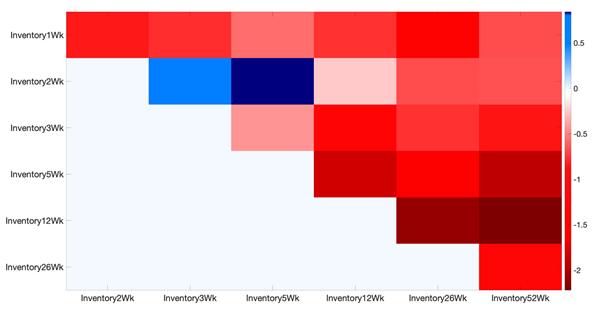
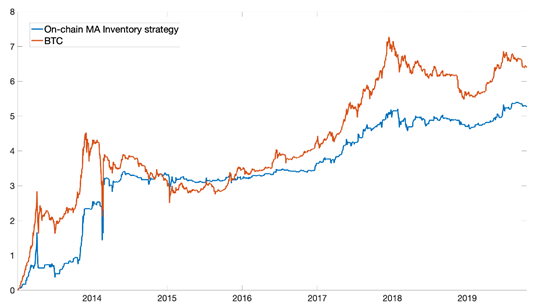
The next step is to collect the best performing strategy and backtest it against a simple buy-and-hold on the BTC/USD pair. Figure 10 shows the results. Interestingly, a trading signal based on BTC inventories does not consistently outperform a simple BTC buy-and-hold strategy. That means that as far as pure scarcity measures are concerned, they do not seem to provide an economically valuable signal to capture BTC market trends.
Figure 10: Back-testing the BTC inventory trading strategy
Concluding Remarks
In this report we investigate a variety of trading signals based on simple moving-averages of several on-chain indicators. The empirical results show there is indeed some value in using on-chain measures, especially BTC transaction value expressed in USD and the market price. Alternative on-chain metrics such as fees, network-to-transactions-value and inventory, turn out to be less economically useful.