Where is the Crypto Market Heading?
Introduction
Following the all-time highs in November 2021, the crypto market plunged in May and June 2022, hitting the mainstream media for all the wrong reasons. This market plunge and cascade in selling was driven by the LUNA stable coin collapse and its knock-on effects. This resulted in huge losses for some major crypto market players, the biggest being Three Arrows Capital, a crypto hedge fund, which at its peak managed more than $15bn.
Three Arrows Capital was a highly leveraged hedge fund whose default and bankruptcy has had a negative knock-on effect for many centralised crypto lending businesses, some crypto exchanges and hundreds of crypto projects and funds. These events have forced the crypto market into a liquidity crunch and caused a large unwinding of leverage and a major withdrawal of credit from the ecosystem.1 However, this is far from being the first bloodbath that the crypto market has experienced.
The fundamental issues which caused the market turmoil are nothing new: currency peg breaks; high leverage; volumes driven lending with insufficient risk management; or duration mismatches between deposits and loans. These market issues have played out hundreds, if not thousands of times in traditional financial markets. Amidst this chaos, decentralised lending platforms, which unilaterally enforce “the rules” in the absence of a centralised authority, benefitted from the lack of trusted intermediaries, via rules-based over collateralization and position liquidations.2
Beyond the current macro environment, the state of the crypto market indicates that it is in a late-stage bear market. Ecosystem activity resembles that of a typical crypto bear market, with a lower but more stable base of activity. Current market conditions have historically been great value zones for longer term investors who can bear the risk of short-term market volatility and have historically been compensated with higher-than-average medium to long term returns. This does not mean the crypto market has bottomed, it is near impossible to time the market bottom exactly. Identifying market tops and bottoms “in the moment” is more of an art than an exact science, as there will always be unpredictable events. However, the current strong confluence of different market health measures, some of which we review in this article, can give an increasing level of confidence in the probability that we are in a “value zone”, which have historically been good times to regularly accumulate cryptoassets and to dollar cost average purchases over time.
Many have focused on macroeconomic narratives to explain crypto’s recent price action. While crypto does not live in a vacuum and correlation between crypto and equities has picked up in 2022, deeper analysis of crypto market data suggests we could have seen a similar crypto market peak and bear market independent of the current macroeconomic conditions.
In this article, we will introduce the historically regular crypto market cycle, look at the current market drawdown, where we possibly are in the market cycle and what is currently the likely key drivers of the crypto market.
Crypto Market Cycles
The crypto market has historically followed a four-year market cycle relatively closely since its inception in 2008, with exuberant and parabolic market peaks, followed by severe and painful bear markets. These market cycles have roughly followed Bitcoin's so-called halving events, which halve the rate of new bitcoin supply. Bitcoin is typically the first crypto to recover from a bear market bottom. Together with the market dominance of bitcoin, typically making up half or more of the crypto market by market capitalisation, and the fact that it has the longest track record of data, bitcoin is commonly used as a barometer of the crypto market as a whole. We therefore focus primarily on bitcoin for the rest of this analysis. This is akin to using the U.S. economy as a barometer for the health of the world economy.
We are currently coming to the end of the third crypto market cycle with reliable trading prices, with the next bitcoin halving projected for April/May 2024. Historically, crypto bull markets have started more than a year before the bitcoin halving event, possibly driven by the anticipation of the lower future supply and the completing of the washout of the previous market cycle.
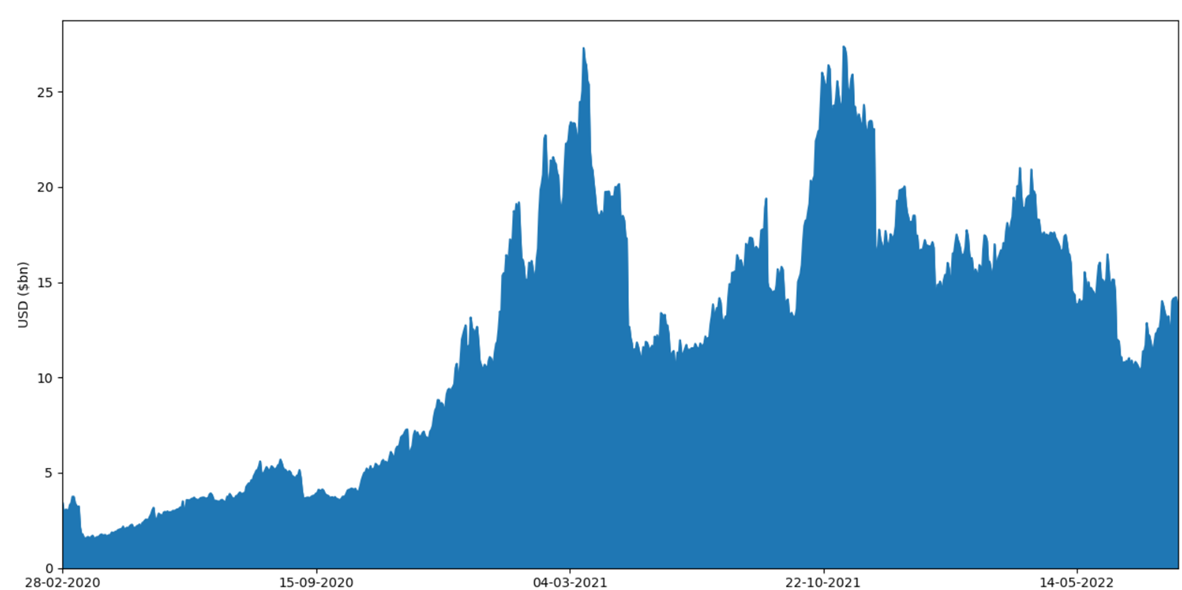
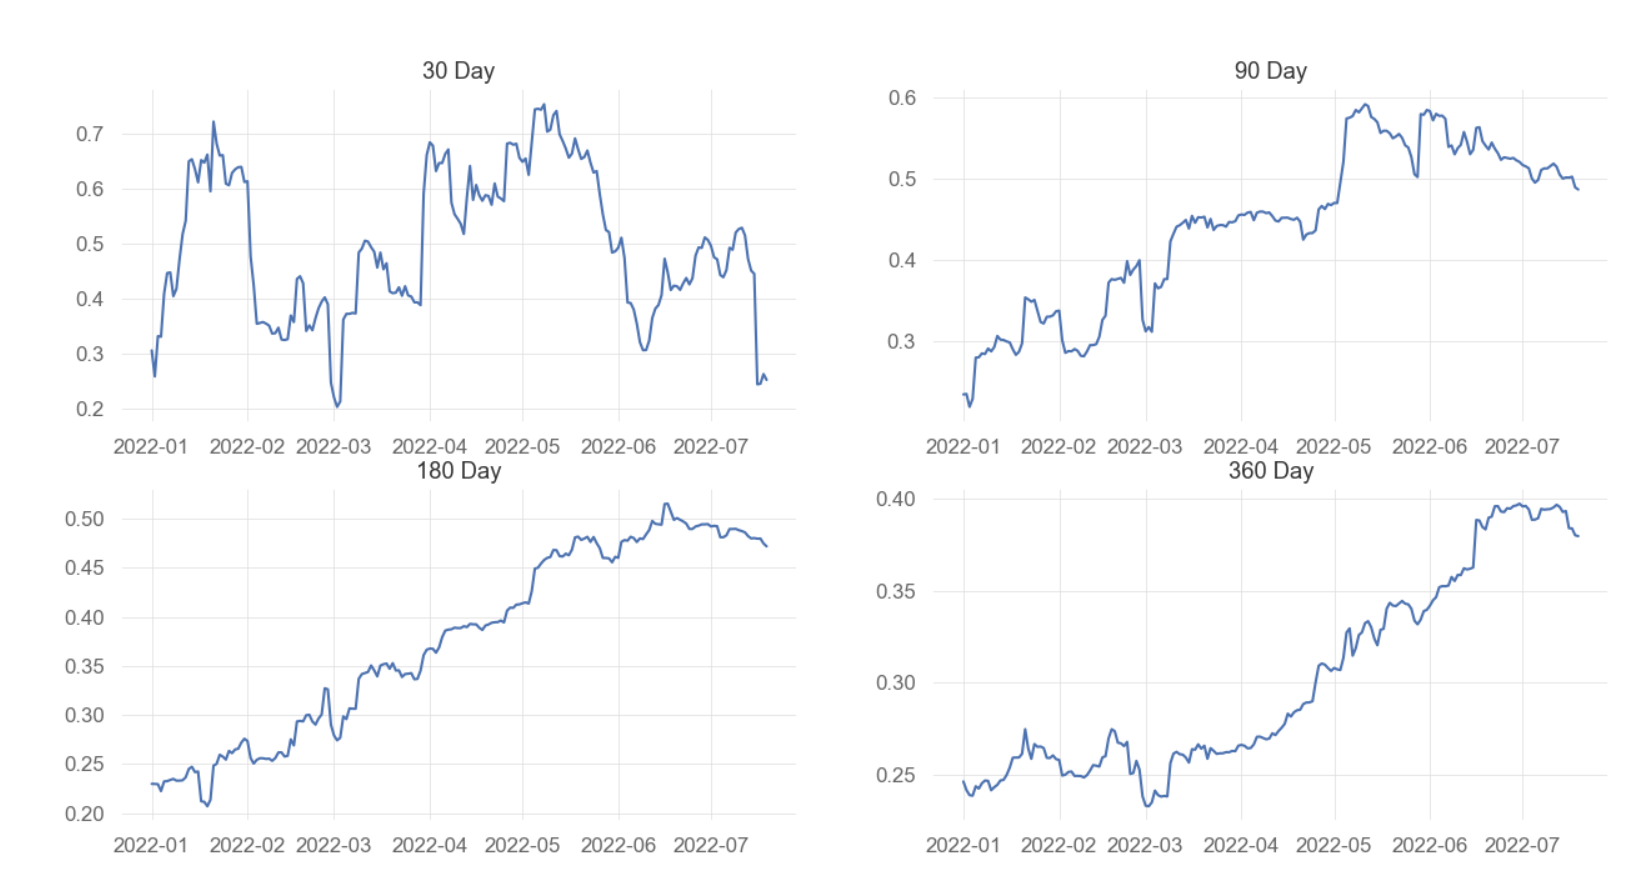
Similar to price, crypto market cycles exhibit similar changes in trade volume and futures open interest. There is a parabolic increase in volumes during the later stage bull-markets with the market correcting back to its stable base of activity in bear markets.
Figure 1: Bitcoin -USD Spot Volumes
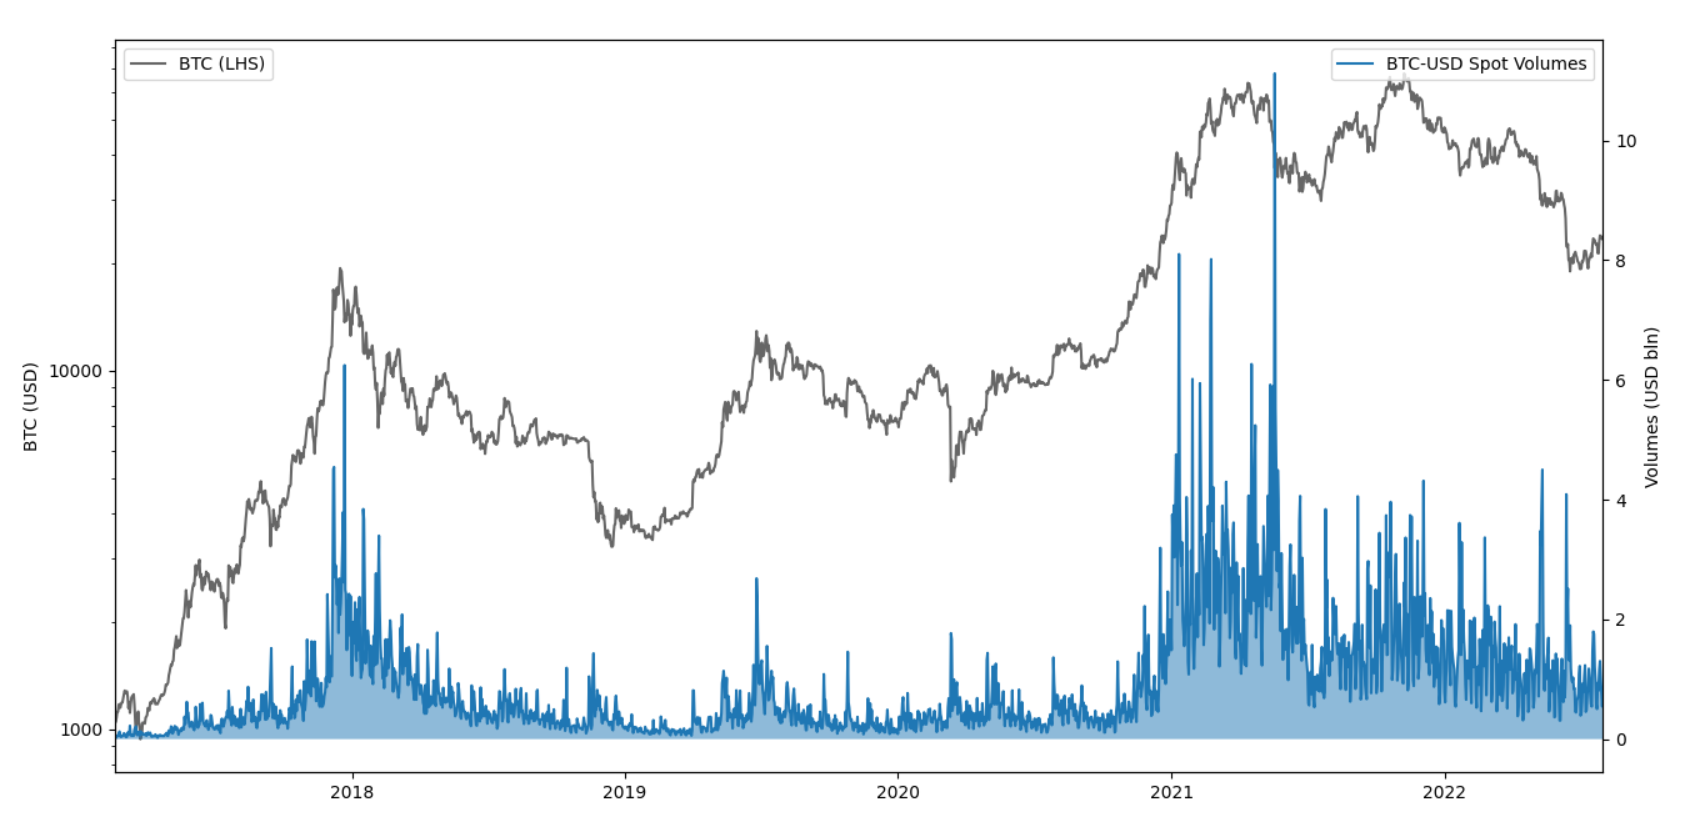
Futures open interest can give some idea of the amount of leverage in the market and hence the potential for violent market movements caused by the rapid unwinding of leverage. The crypto market in general is experiencing relatively lower leverage levels, as evident by the level of futures open interest on exchanges, which is back at levels last seen in late 2020, before the market got extremely overheated in 2021.
Figure 2: Bitcoin Aggregated Futures Open Interest
Historic Bitcoin Drawdowns
A key part of determining where we are in the crypto market cycle is comparing where we are in terms of severity of drawdowns relative to previous bitcoin bear markets.
Table 1: BTC Largest Drawdowns
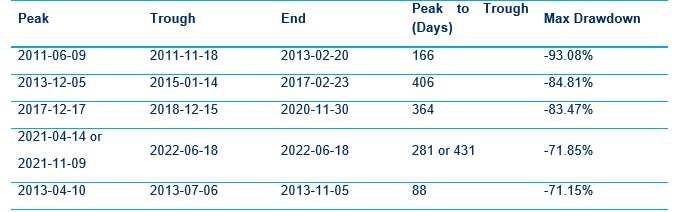
For more context around these historical drawdown numbers, we can visualise maximum drawdowns experienced in each market cycle.
Figure 3: Bitcoin Max Drawdowns Over Market Cycles

While the particulars of each market cycle are different, the dynamics of each cycle are similar.
The maximum drawdown of the current market cycle has so far been less severe than previous cycles. The crypto market tops and bottoms appear to be becoming less extreme over time as the market matures and the crypto derivatives markets grows, which can help moderate market cycles.3
This moderation is typically how new markets evolve over time. We have seen signs of this in 2021, where the market frenzy peak of April 2021 did not see market valuation metrics nearly as stretched as in previous market cycles, and this could potentially explain why the weaker market rallies of late 2021 were able to set an all-time high for bitcoin.
Taking this into account, we could see the maximum drawdown of the current market cycle be less severe than in previous cycles which in turn might suggest we could be near the market bottom. However, a key difference is that both bitcoin and Ether broke down from their previous all-time highs in December 2017 and January 2018 respectively. This is the first time over a market cycle that this has occurred.
Depending on where one defines the start of the bear market, the end of the market frenzy in April 2021, or the price peak in November 2021, the duration of the bear market could also suggest we are near the market bottom, based purely on what has happened before.
Where we are in the Current Crypto Market Cycle?
To understand where we are in the current market cycle, we need to form a rounded view of current market health based on a variety of data points that establish a consistent narrative.
A key difference between crypto and traditional markets is the transparency of on-chain blockchain data, which provides the ability to recognise patterns and behaviours of blockchain users via their transactional data, known as on-chain data.
Looking at the on-chain data and identifying patterns of peak and bottom levels can help determine the current stage of the crypto market cycle and how the market may develop in the future. While history does not repeat itself, it tends to rhyme.
The first measure of market health that we will look at is the unrealised profit and loss of market participants. An investor who is sitting on large profits will often act differently to someone who is sitting on large losses, especially if they have liabilities to manage.
To measure this, we can analyse the price at which bitcoins were last transacted on-chain (i.e. the price at which bitcoins were transferred). This can be used to approximatethe price investors bought their current bitcoin holdings. This concept is known as the Realized Price.4
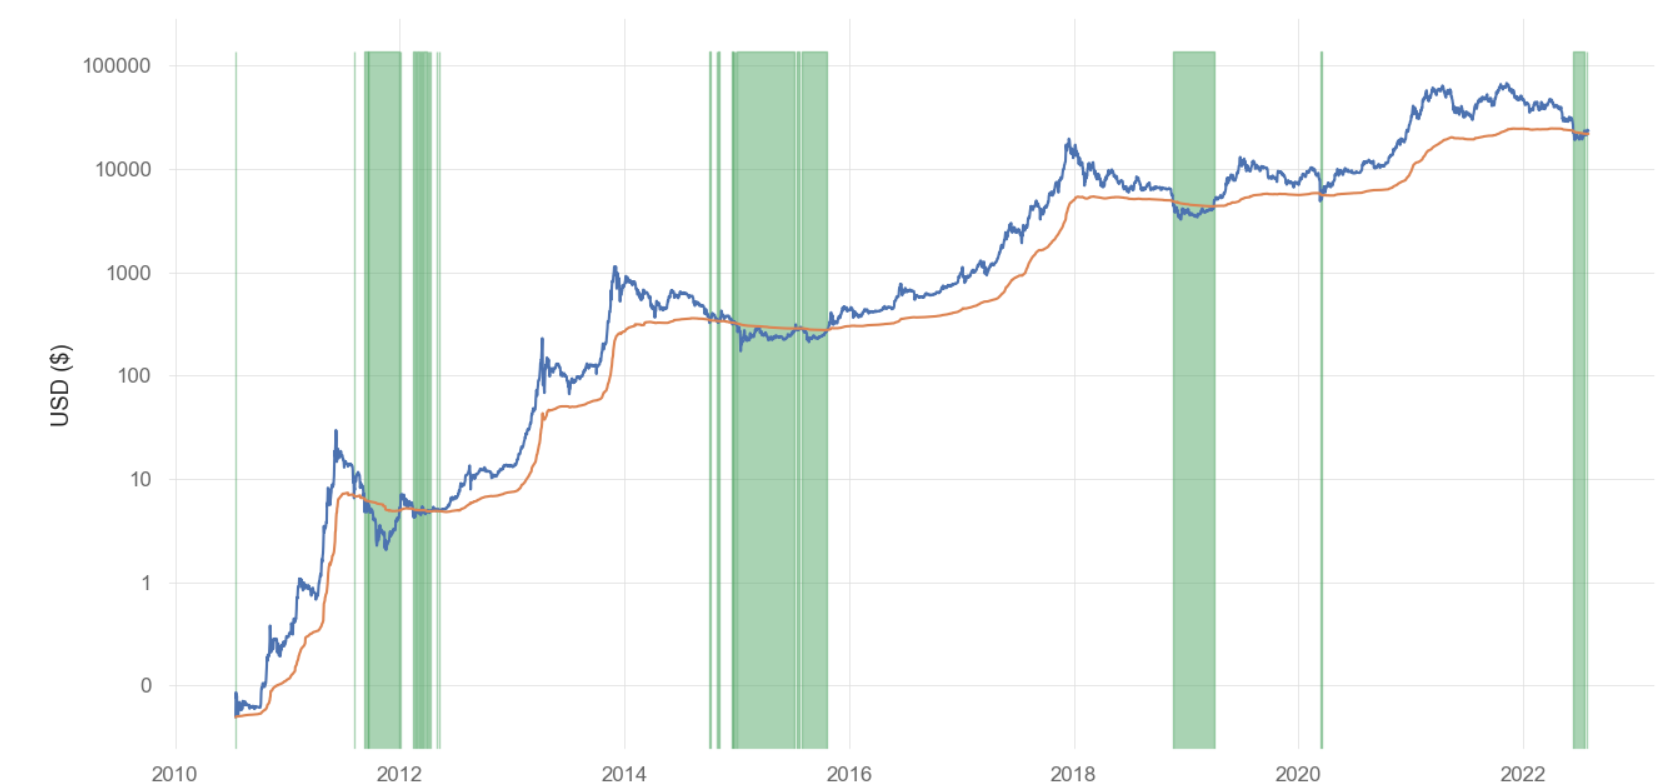
Comparing the Current Price (i.e. the market price) to the average Realized Price of the market, we can identify periods when the Current Price is lower than the average Realized Price, hence on average, holders of bitcoin have an unrealised loss. Historically, there have been only a few periods in each market cycle where this has occurred, all of them previously proving to be value zones for bitcoin and usually occurring during late-stage bear markets.
Figure 4 shows bitcoin’s price in blue and Realized Price in orange, while the green vertical bars highlight the zones where the bitcoin’s price was lower than the Realized Price. Currently, we are in a green value zone.
Figure 4: Bitcoin’s Realized Price
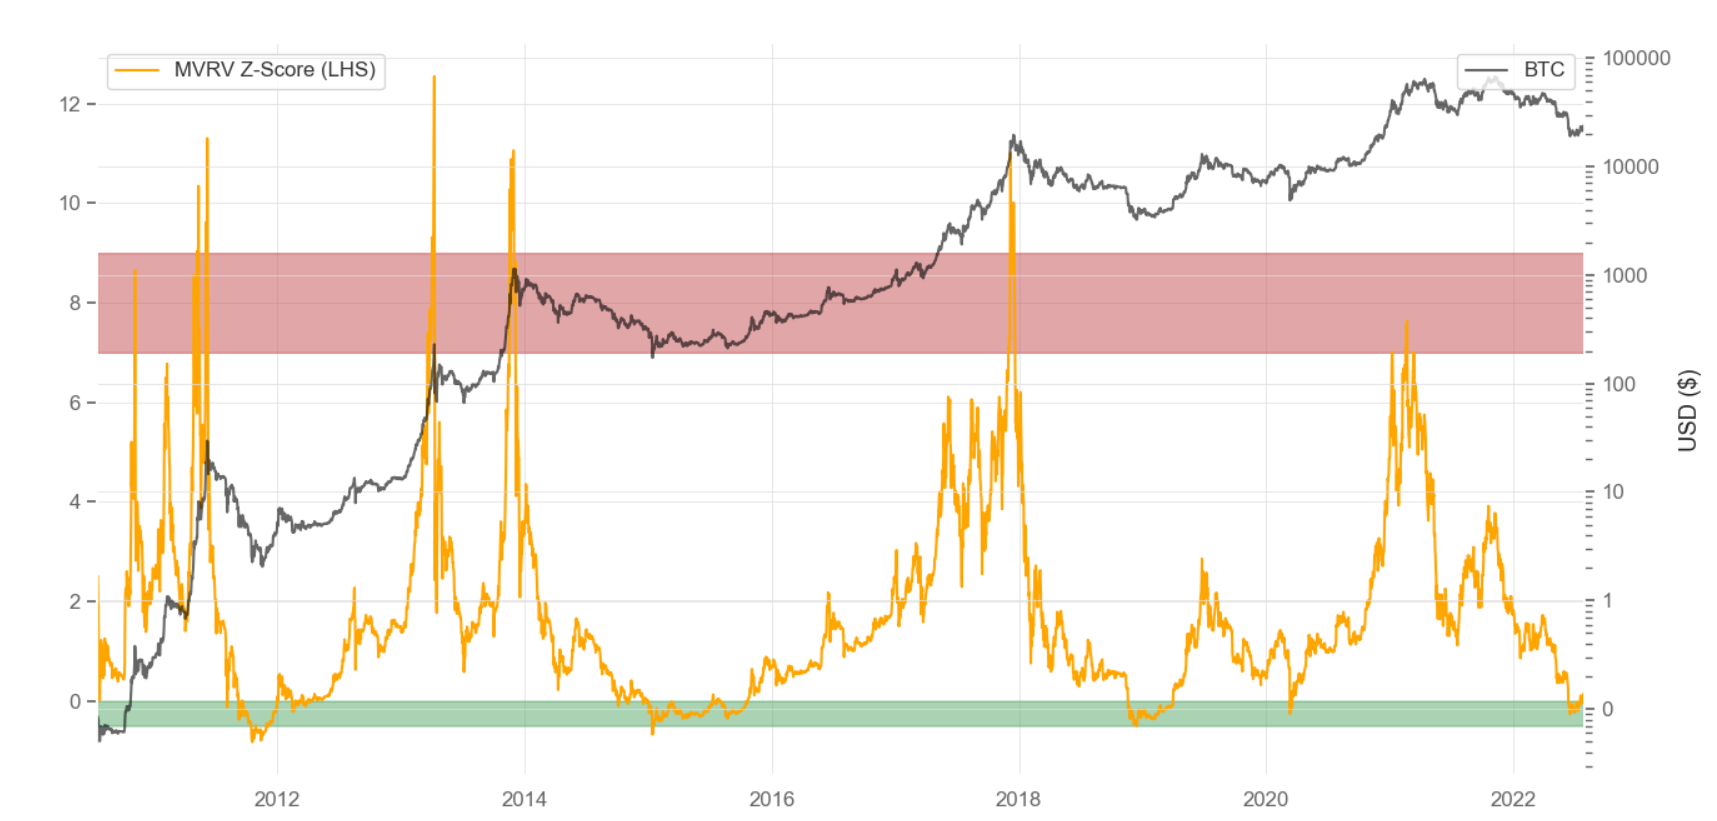
We can also use the Realized Price to determine whether bitcoin appears to be under or overvalued. The Market Value Realized Value (MVRV) Z-score is used to assess when bitcoin is either over or undervalued relative to its historical “fair value”.5 It is calculated using the following formula:

Figure 5 shows the MVRV Z-score and the bitcoin price. The MVRV Z-score value in the “green zone” highlights periods when bitcoin was undervalued based on historical norms and has signalled market bottoms. Similarly, Z score values in the “red zone” highlights periods when bitcoin was overvalued relative to historical norms and has signalled market tops. Currently, the MVRV Z-score is just above the green zone following the price rally in late July.
Figure 5: Bitcoin’s MVRV Z-Score
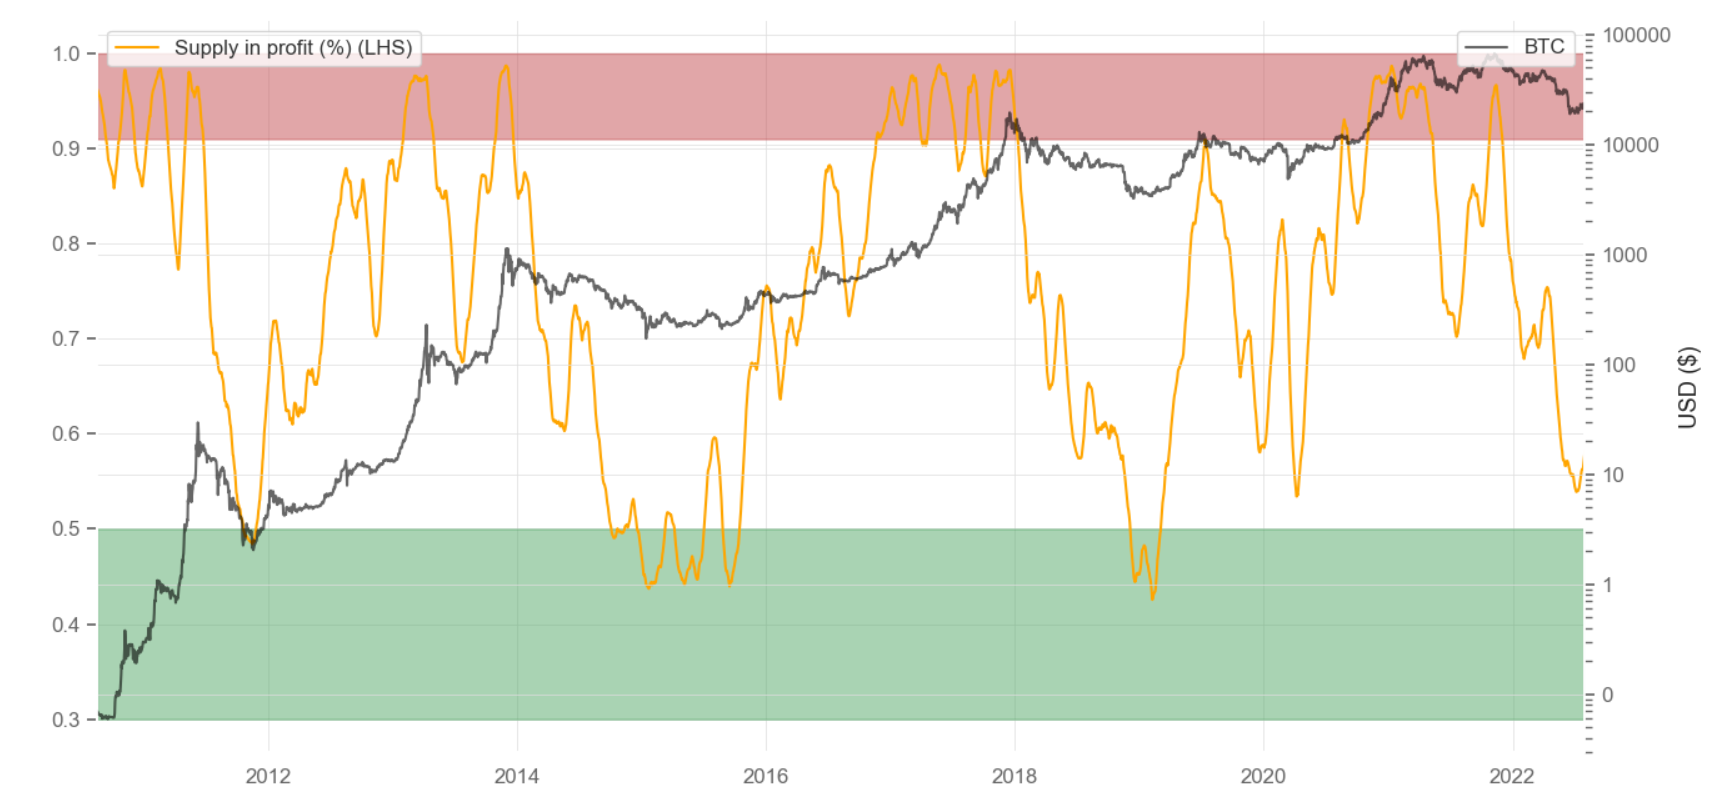
Looking at the same realized price data, we can also calculate what percentage of all bitcoins are being held at an unrealised profit or loss. The percentage supply in profit can be used as a proxy for market sentiment and financial distress, which are important drivers of market cycles and has historically acted as a good indicator for identifying market tops and bottoms.6
Generally, when more than 95% of the supply in profit, it indicates that the market is closer to its cycle top while less than 50% of supply in profit tends to indicate market bottoms.
Figure 6 below shows the percentage bitcoin supply held in profit and bitcoin’s price. At the current market bottom of $19,200 (daily market close) on 18th June 2022, 50.27% of supply was in profit. Note that the intra-day bottom for bitcoin was around $17,600 in the middle of June 2022, where profitability was below 50% and in the green zone.
Figure 6: Bitcoin % Supply Held in Profit
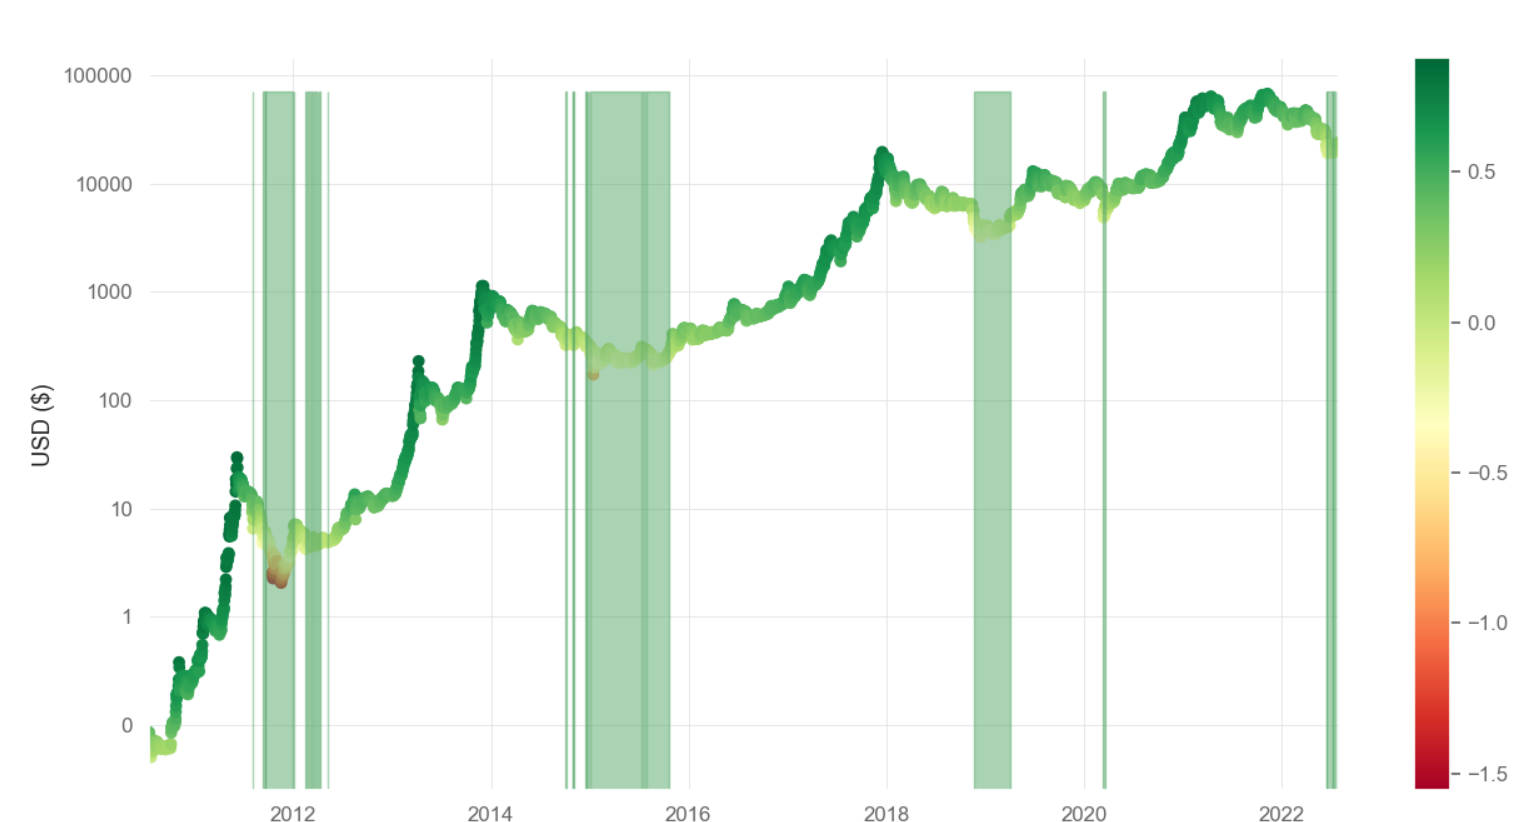
To ensure robustness, we should look at this data in different ways to ensure it yields a consistent message. We can also examine the actual USD value by which each bitcoin is in unrealised profit or loss. This is known as the Net Unrealized Profit/Loss (NUPL).7
Figure 7 shows NUPL and bitcoin’s price. The green vertical lines identify where the unrealised loss is greater than the unrealized profit, which has historically been bitcoin value zones. Currently, we are in a green zone.
Figure 7: Bitcoin’s Net Unrealized Profit/Loss and Price
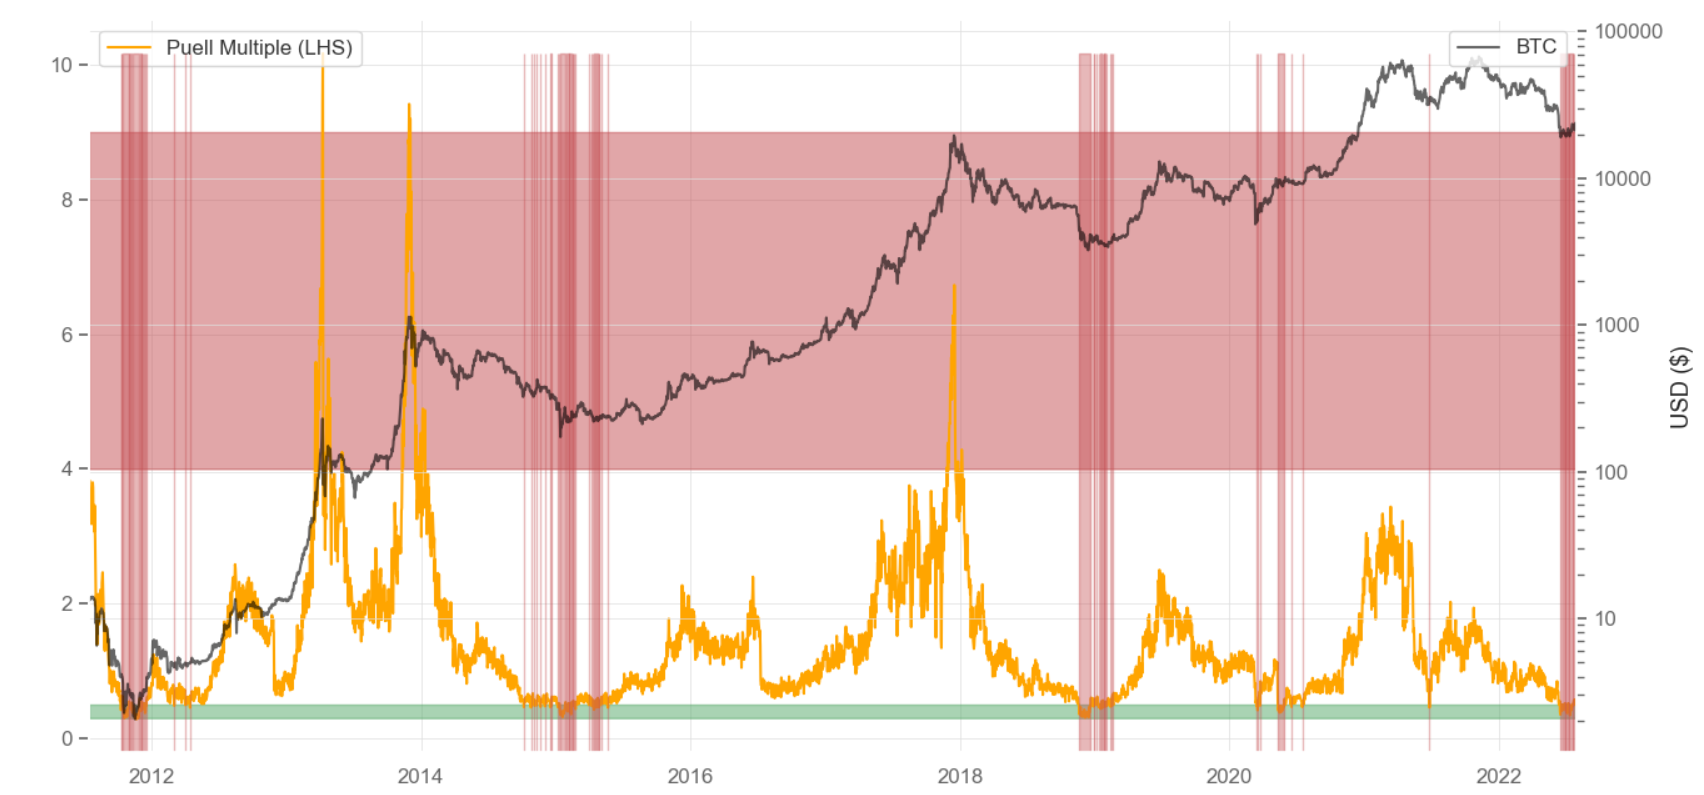
We can also identify specific types of bitcoin holders. One group of bitcoin holders which are of specific interest are bitcoin miners. The bitcoin mining industry is commonly referred to as bitcoin insiders as they generally have a deep understanding of the technicals of bitcoin, knowledge on the state of the bitcoin market and ecosystem and have been in the market for several crypto market cycles.
They are classified as compulsory sellers as they have fixed mining costs to cover and their profitability plays an important part in shaping bitcoin’s market cycles.8 The Puell Multiple (shown below) shows the daily coin issuance by miners divided by the one year moving average:

The green zone indicates a low Puell Multiple, where bitcoin miners are selling less than average revenues in USD terms, which can be used as a proxy for potential financial stress of miners. Low Puell Multiples have historically occurred during late-stage bear markets with the clear exception being in mid-2021, which was due to the great bitcoin mining industry migration out of China following the formal mining ban. The Puell Multiple has recently entered the green zone.
Figure 8: Bitcoin Puell Multiple
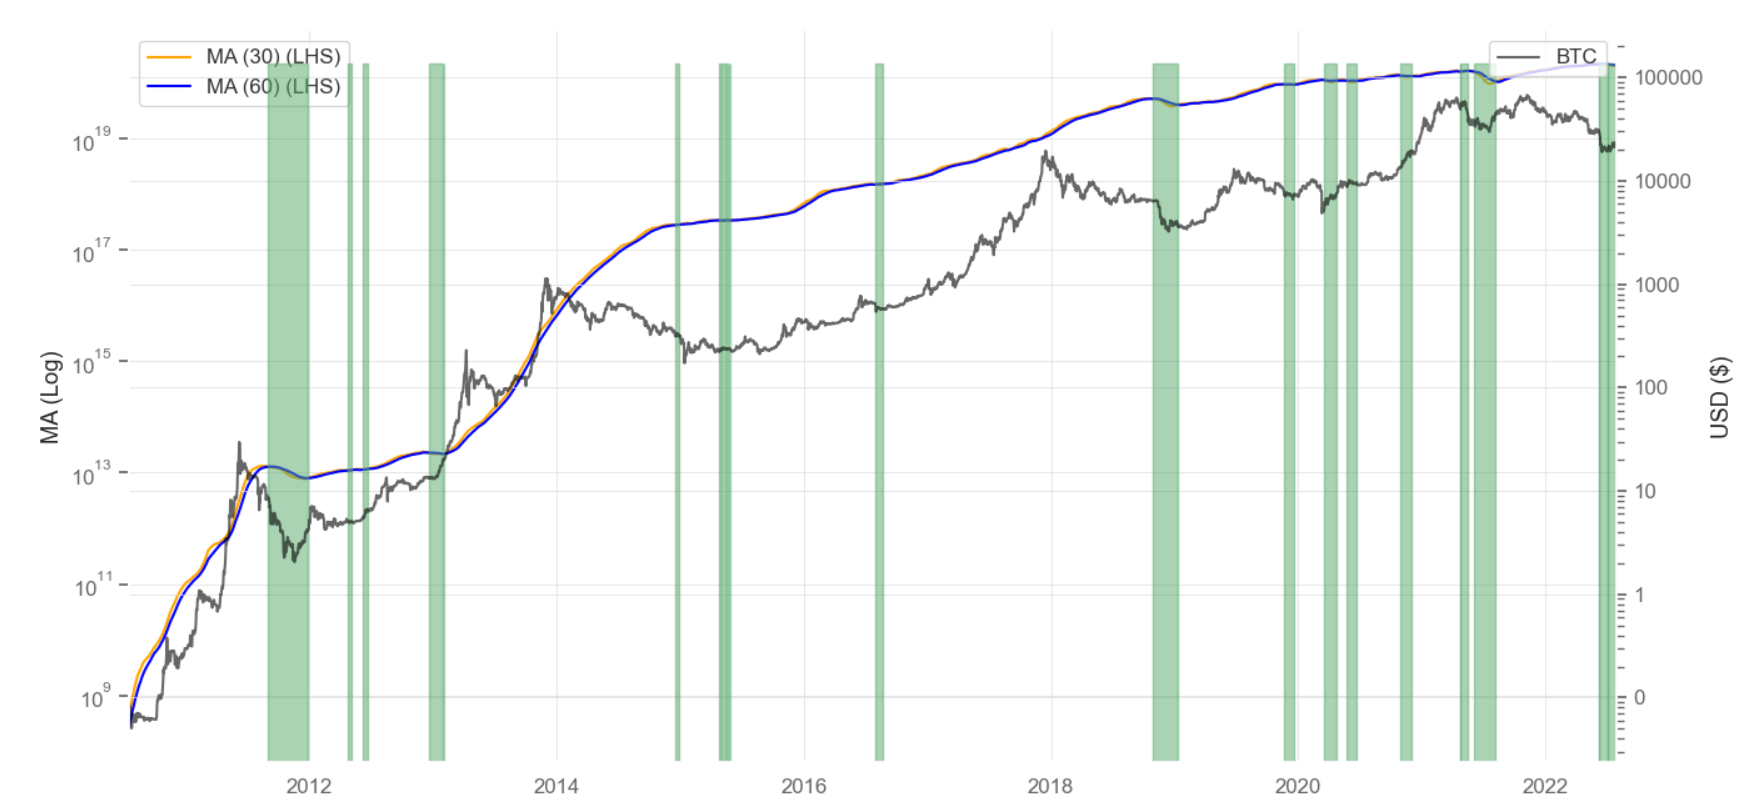
There are also other proxies for identifying when the bitcoin mining industry is under financial stress. We can also identify periods when bitcoin becomes too expensive to mine for some miners. The hash rate measures the average computing power actively used by miner son a daily basis. Essentially, a higher hash rate indicates a strong bitcoin network and vice versa.
Hash Ribbon is a market indicator that identifies likely financial stress in the bitcoin mining industry by looking at downward trends in moving averages of the Bitcoin hash rate. When a slower moving average, the 60-day moving average of Bitcoin’s hash rate crosses above a faster moving average, the 30-day moving average, its commonly used as a flag for financial stress in the bitcoin mining industry.9
This is shown in the Figure 9. green vertical zones identify the aforementioned scenario and have historically generally identified bitcoin value zones. We are currently in the green zone.
Figure 9: Bitcoin Hash Ribbon
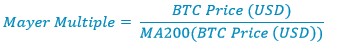
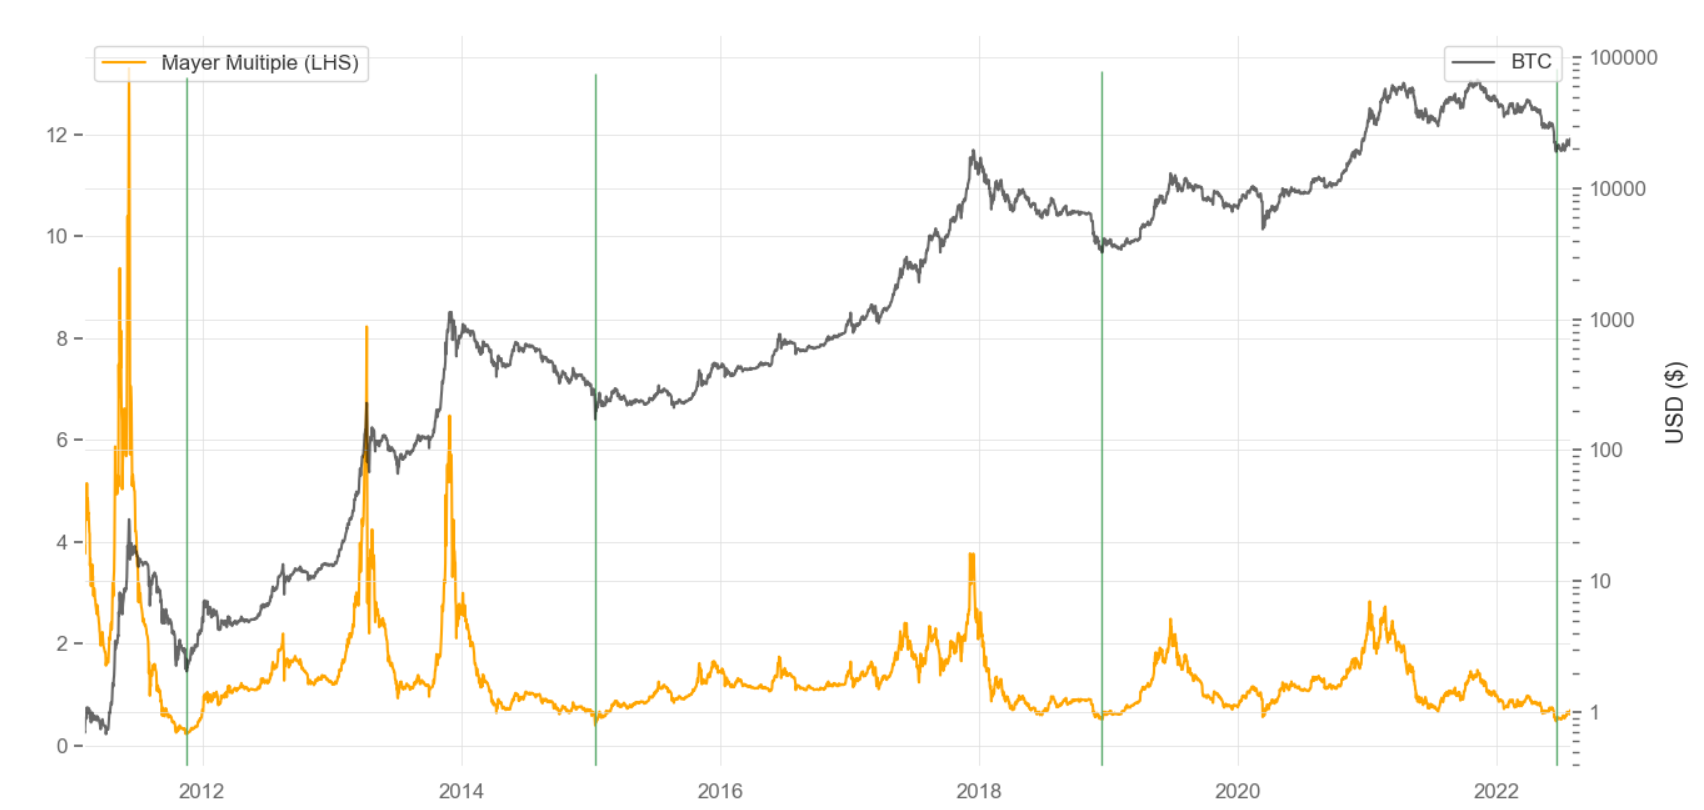
A more traditional way of accessing market heal this technical analysis, which attempts to understand at which price the market is willing to buy and sell, and how much. Technical indicators based on price data provides further information which can be used to identify overbought or oversold conditions for bitcoin. One such indicator is the Mayer Multiple, which takes the current price of Bitcoin and divides it by the 200-day moving average.10
The green vertical lines in Figure 10 highlights the minimum value of the Mayer Multiple over the bitcoin halving cycles, including the current one. The current value is also close to all-time low for the metric, indicating oversold conditions.
Figure 10: Bitcoin Mayer Multiple
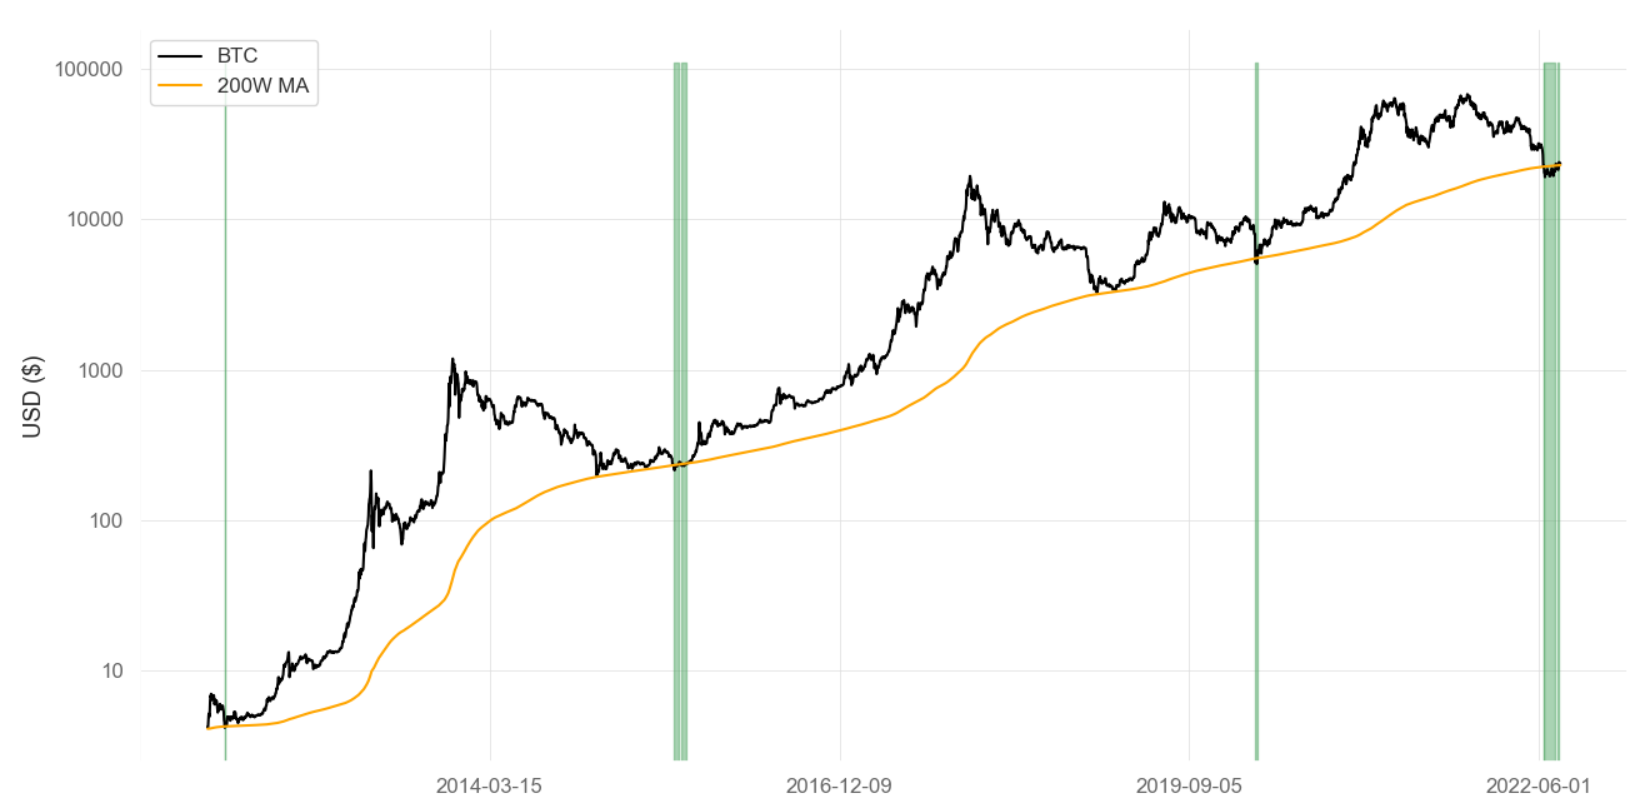
Another popular technical indicator which is used to identify market bottoms is the bitcoin 200 week Moving Average.11 The green vertical lines in Figure 11 highlight when the current bitcoin price has gone below the 200-week Moving Average, which have historically been extreme value opportunities.
Figure 11: Bitcoin 200 Week Moving Average
Who’s Buying Bitcoin Right Now?
Late-stage bear markets are where the final market bottom is established and tend to exhibit certain characteristics. The market dynamics of late-stage bear markets are similar regardless of the asset class. They are largely driven by the same human emotions of extreme fear, where there appears to be no end to bad market news. The second key driver of late-stage bear markets is the dynamics between sellers, who are the so-called “weak hands” and the buyers, so-called “strong hands”. Weak hands are those who have lost conviction, who want to just get out to limit their losses or are forced sellers due to their difficult financial situation.
The buyers in these markets are strong hands whose conviction remains and can afford to risk further losses in the short term in order to make larger profits in the medium to long term. The market cycle bottom arises when the weak hands run out of bitcoin to sell. This causes prices to create a “U” shaped bottom where price starts to increase gradually as the strong hands continue to buy.
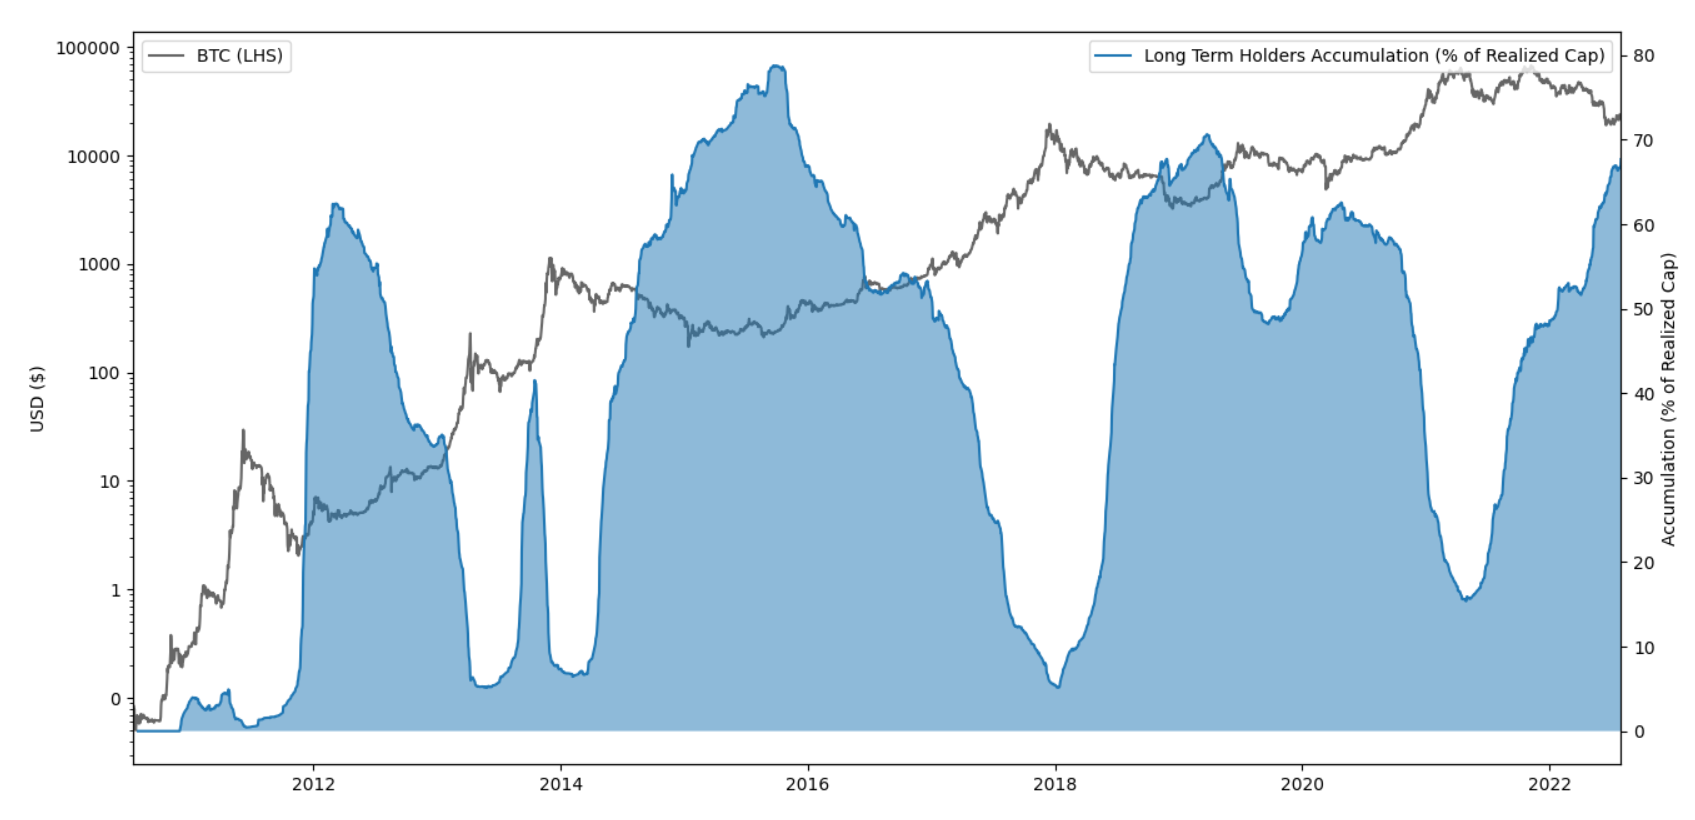
A commonly used proxy for strong hands in the data are Long-Term Holders (LTH), identified as entities who have held bitcoin for more than 155 days. Past this point, holders of bitcoin tend to have stronger long-term conviction and are less likely to sell in the foreseeable future.12 LTHs tend to be more sophisticated investors who usually sell at higher prices and buy at lower prices. They do this by accumulating bitcoin during times of market weakness and gradually sell their bitcoin during strong bull markets. This is evident from Figure 12.
Figure 12: Bitcoin Long Term Holders Accumulation
Illiquid supply shows a similar story to the LTH’s chart above. The first 7 months of 2022have witnessed a clear increase in illiquid supply, i.e. coins are being moved to wallets with little or no history of spending and steady decrease in liquidity supply, with a possible supply squeeze forming.13 This is characteristic of market bottom formations, where the majority of the supply is held by strong hands who have little intention of selling until prices are higher.
We can also see who has been buying and selling in the last 90 days based on the change in their accumulation or selling patterns on-chain, by duration of their investment. This is shown in the heatmap below.
Figure 13: Bitcoin % Change Realised Cap HODL Accumulation/Selling (30 day Mean)
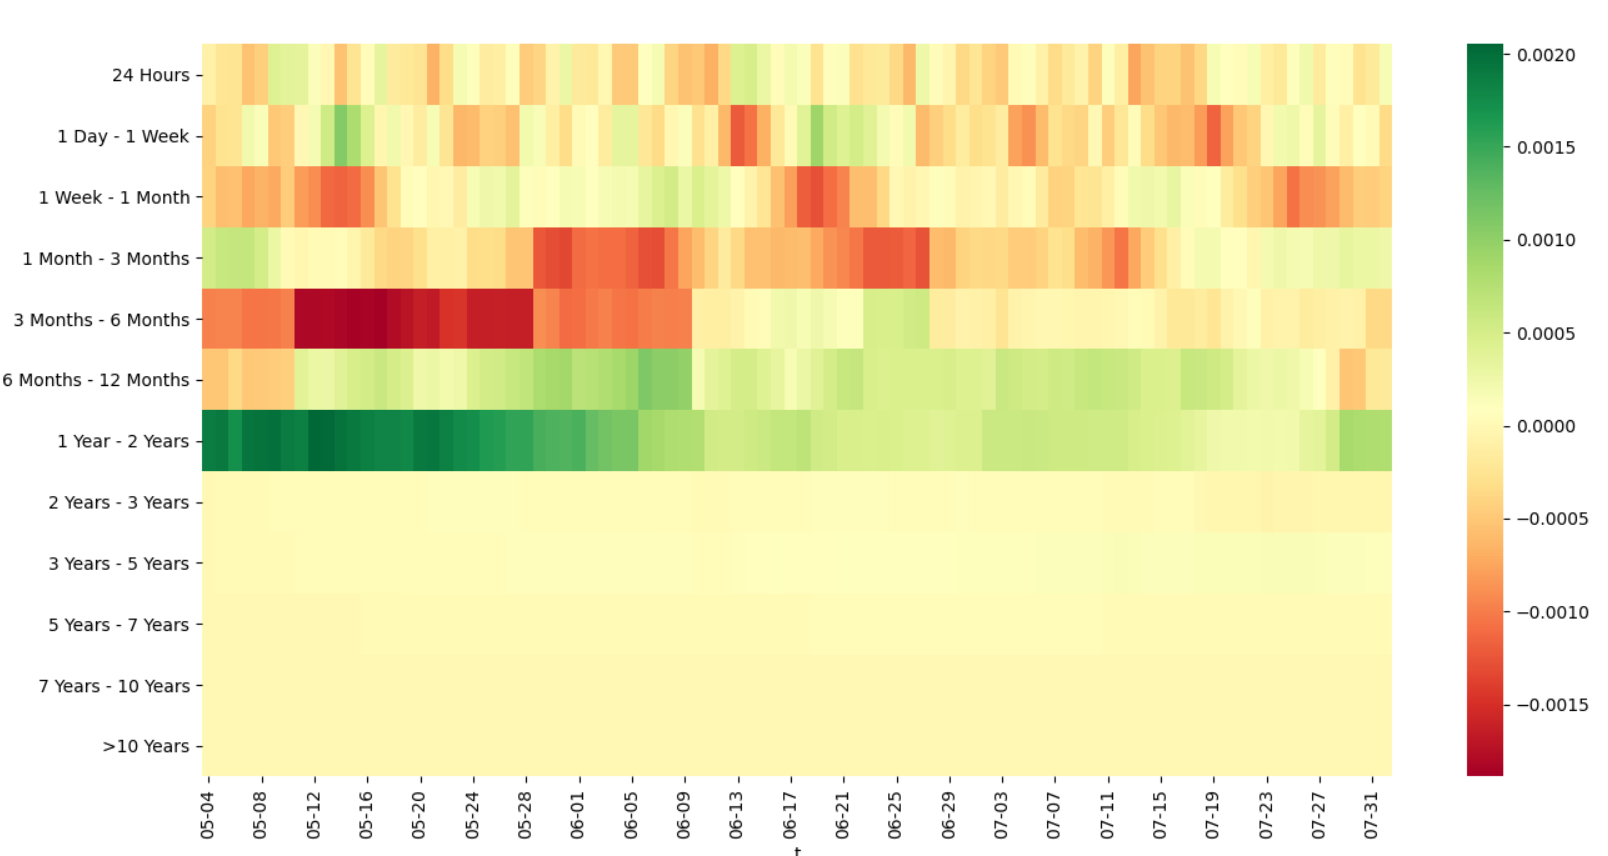
During the May and June 2022 market sell-off, a lot of the selling came from short-term holders, specifically 3 Months to 6 Month holders. Conversely, there was some bitcoin accumulation by the long-term holders, specifically 1 Year to 2 Year holders, who still have conviction in the market and continue to accumulate bitcoin. As can be seen, the selling was not due to a widespread loss of confidence, but due to short-term holders selling, who are on average the weaker hands in the market.
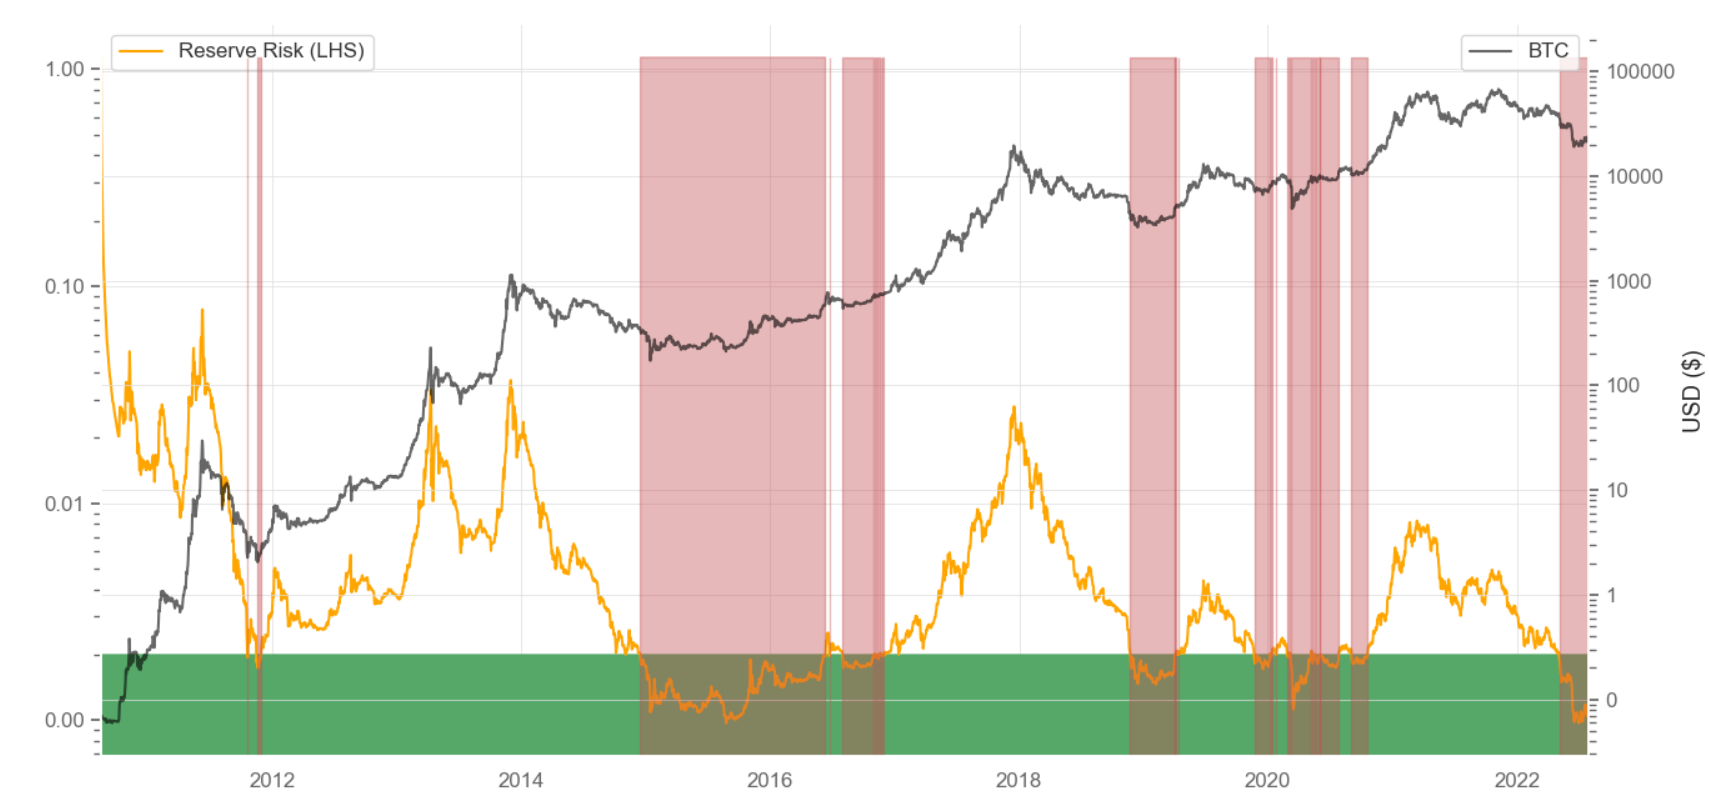
The primary driver of buying and selling decisions by LTHs is the risk level and the reward they earn as compensation. The risk/reward ratio for LTHs could enable us to pinpoint the prices at which they generally tend to buy or sell. Reserve Risk is a metric that is used to assess the confidence of LTHs relative to the price of bitcoin at any given point in time. This is done via calculating the cumulative opportunity cost for holding bitcoin vs selling bitcoin for LTHs.

Figure 14 below shows the Reserve Risk and bitcoin prices.14 The red vertical zones highlight the times when Reserve Risk fell into the value zone and therefore the LTH’s risk/reward ratio is extremely high. These periods have historically coincided with late-stage bear markets, which have presented good value opportunities over the market cycle. Currently, the Reserve Risk is in a value zone.
Figure 14: Bitcoin Reserve Risk
When are the Future Returns the Highest?
Most of the crypto market cycle indicators are currently at levels which have historically been seen during late-stage bear markets and have historically presented good opportunities for a long-term investment. However, when prices continue to fall, it seems that the market will carry on falling and when prices are rallying, they will carry on going up. It can therefore be freighting to buy after the market has had a long losing streak. However, the aim as an investor is to buy low and sell high, to buy after a large market drop and sell after a market rally.
The heatmap below shows the investment returns from buying bitcoin after a market rally or market drop.
Figure 15: Hypothetical Investments Returns Heatmap
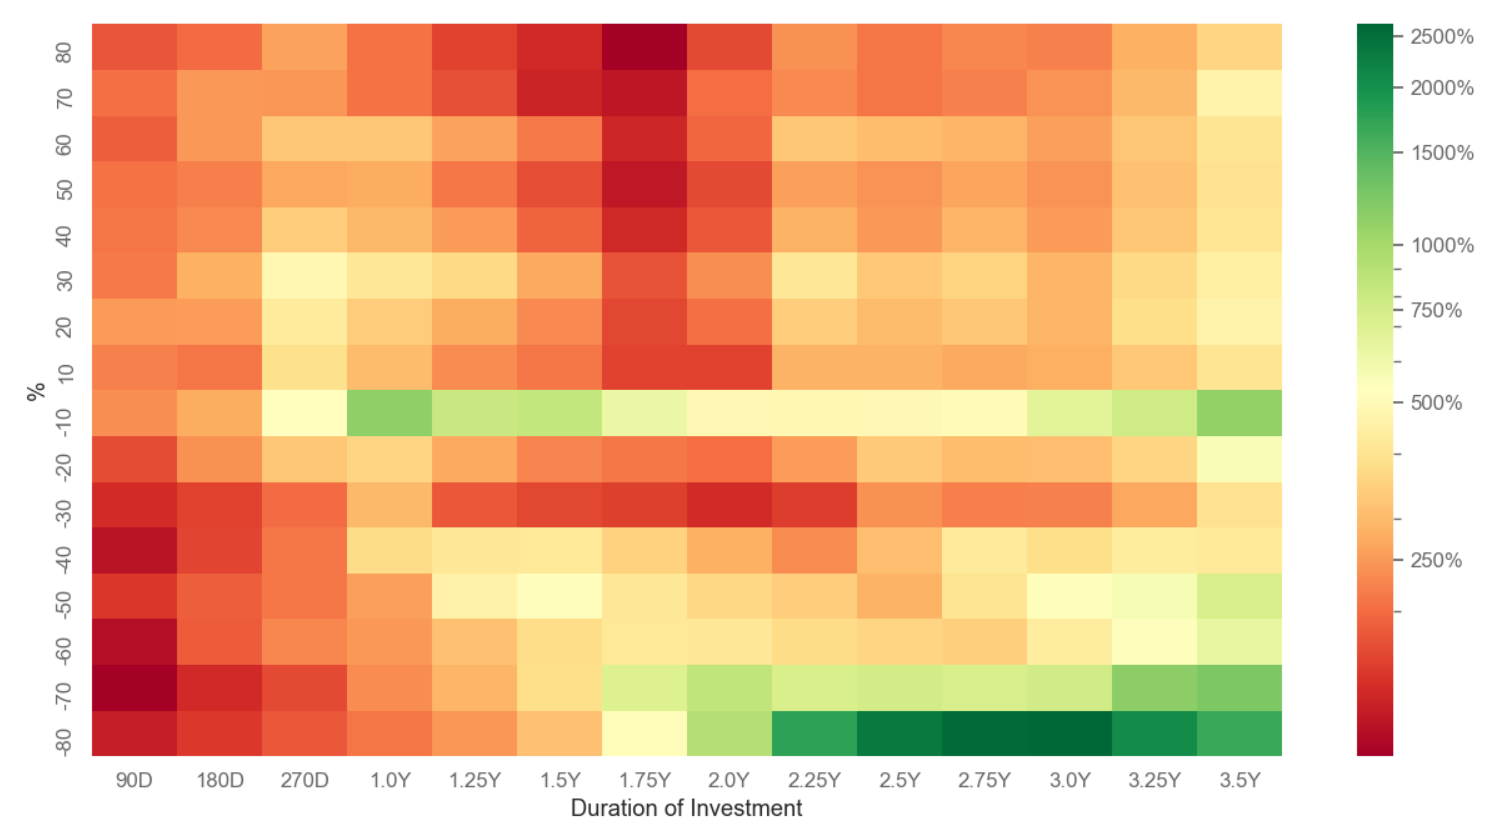
The X-axis shows the period for which the hypothetical investment in bitcoin is held, while Y-axis shows the percentage the market had rallied or fallen at the point the investment was made. The heatmap shows the average cumulative returns for multiple hypothetical investments made during bullish (positive return environment) and bearish (negative return environment) market periods, with the colour scale shown on the right side of the figure. Red highlights lower returns while green indicates higher average cumulative returns.
Investing in bitcoin during bearish market conditions after extreme market drops and holding that investment for a longer period historically has led to much better returns relative to investing in bull market conditions i.e. after a market rally.
What About the Wider Macroeconomic Backdrop?
Since their inception, bitcoin and cryptoassets have not experienced a tightening macroeconomic environment with high inflation and a possible recession. Since the start of the year, bitcoin and other cryptoassets have experienced higher correlations to equities, exhibiting the properties of risk-on assets. Prior to 2022, even in late 2021, the correlations between crypto and all other asset classes were close to zero and short lived, with the exception being the COVID-19 induced market liquidity crunch in March 2020. Liquidity crunches, by their very nature always hit all non-cash assets, even “safe haven” and low correlation assets such as bonds or gold.
Figure 16: Bitcoin and Vanguard Total World Stock Index Rolling Correlation
In spite of the recent higher correlations, statistical analysis suggests that the risk factors which drive equity markets do not generally drive cryptoasset markets. One must therefore be careful in assuming the high correlation between equities and cryptoassets will persist.15 It is also important to remember that market correlations are an aggregated measure, which is the average of many independent buyers and sellers who may act differently to the same situation.
Especially for crypto, different market participants treat crypto differently within their portfolio. Some treat crypto as a safe haven “digital gold” asset, others as an uncorrelated asset, more traditional investors as a risk-on asset or a technology stock. There are also some technical difficulties with correlation analysis between equities and crypto, including difference in trading hours.
Analysis of futures and spot markets for bitcoin suggests that the increased correlations between crypto and other asset classes appears to be largely driven by futures markets, which have been driving the crypto market down. The bitcoin futures market currently represents around 60% of bitcoin’s trading volumes and so can control the price narrative in the short term. However, as any sophisticated investor will know, medium to long term prices are determined by the demand and supply in the underlying spot markets.
There is less evidence of a traditional risk rotation happening among bitcoin spot holders, looking at the size, trading hours and investment period of bitcoin’s spot sellers. These sellers generally look similar to the sellers in previous bitcoin bear markets, i.e. the “weak hands”. While some crypto holders have used derivatives to reduce their crypto market exposure instead of selling, this approach typically used for shorter term risk management as opposed to a portfolio risk rotation.
More generally, at its very core, the dynamics of the data for current bitcoin bear market is very similar to that of previous bear markets. These previous crypto bear markets happened in more favourable macroeconomic conditions than the current one and likely independently from the coinciding macro conditions. Based purely on previous crypto market cycle timings, a crypto market peak in the second half of 2021 and a deep bear market in 2022 was always likely, independent from macroeconomic conditions.
It is therefore hard to claim that bitcoin spot selling was primarily driven by macroeconomic factors.
The large amount of selling and buying in the bitcoin spot market over the past six months has changed the composition of bitcoin holders, from newer investors in crypto, to those who have long term conviction in the market and to those who are more crypto native and are thus less affected by macro conditions outside of the crypto market.
On-chain metrics are indicating that the number of active addresses is currently approaching the deepest historical bear market territory. The network is approaching a state where almost all speculative entities have been completely driven out while the number of addresses with a non-zero balance continues to grow.16
It is these bitcoin demand and liquid supply dynamics which will help form the cryptomarket cycle bottom and initiate the next bull market.
Conclusion
Overall, analysis of the cryptoasset market data, in particular the bitcoin ecosystem data, clearly points towards a late-stage bear market. Whether we have already seen the market bottom or not is never clear until the next bull market has firmly taken hold. Identifying market tops and bottoms “in the moment” is more of an art than a science.
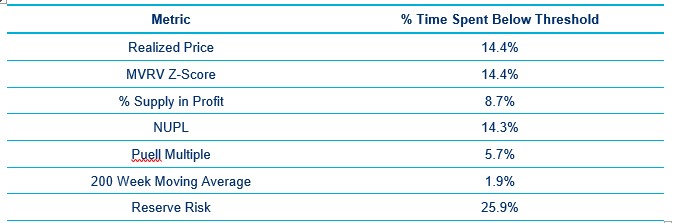
However, a strong confluence of different market health measures can give us increasing confidence in the probability that we are at or near the bottom. Most market cycle bottom metrics are in the “cheap price” zones and historically, as shown by the table below, these metrics have stayed at such levels for a very limited amount of time.
Table 2: Bitcoin Market Bottom Metrics
Current markets conditions have historically been great value zones for longer term investors who can bear the risk of possible short term market volatility, who have historically been compensated with higher than average, medium to long term returns. These value zones have historically been great periods to regularly accumulate cryptoassets and for dollar cost average buying over time. As with any market, while history does not repeat itself, it tends to rhyme as the human emotions and the financial situation of market participates are similar.
The question as always is, is this time different? Crypto is no stranger to extreme market crashes and major market players and service providers going bust. Despite the rapid evolution of the crypto market and the different macroeconomic conditions, at its very core, crypto and bitcoin ecosystem activity and data resembles that of a typical crypto bear market, with a lower but more stable base of activity Many have focused on possible macroeconomic drivers of the current crypto market. However, while crypto does not live in a vacuum and there have been instances of possible macro contagion effects, deeper analysis of crypto market data suggests we could have seen a similar crypto market peak and bear market independent of the current macroeconomic conditions. The media has reported bitcoin as being dead no fewer than 459 times.17 So far bitcoin and crypto has not only always survived, it has always thrived and grown ever more robust, with the proliferation of use cases.
While the initial idea behind cryptocurrencies was digital cash, the evolution of the technology in second and third generation crypto platforms now enable something far more powerful, Web 3.0. Crypto is a next-generation, value-based internet. As HTTP and HTML are the platform of the World Wide Web, Ethereum and other crypto networks are the platforms of Web 3.0. Web 3.0 is the integration of Industrial Revolution 4.0 technologies and native value management into the internet. So far, the financial payment rails have been kept separate from the Web, but in a digital world where data, money and value are so intertwined, this separation makes less and less sense. Unlocking this potential value revolves around data sharing and flow. The new Web 3.0 business models and infrastructure stack are inherently better at achieving this data integration than the current Web 2.0 business models and infrastructure stack, due to decentralisation enabled via DLT.
Looking at the bigger picture, cryptoassets and DLT are key to the Fourth Industrial Revolution and its use cases are intertwined with technologies such as the Internet of Things, Big Data and Artificial Intelligence. While DLT is the technological innovation, cryptoassets is the economic innovation and they go hand in hand. Cryptoassets and DLT have the potential to disrupt virtually every industry and has applications throughout many different value chains. Key areas for disruption are finance, insurance, healthcare, supply chains and digital identity. Governments, banks, and other large corporations are now getting behind both DLT and cryptoassets. Many established companies, ranging from Amazon to JP Morgan to Paypal, are now involved.
Footnotes
1Number Three. (Any views expressed in the below are… | by Arthur Hayes | Jul, 2022 | Entrepreneur's Handbook (entrepreneurshandbook.co)
2Aaro Capital: Introductory Guide to DLT and Cryptoassets
3For more information, please refer to Effect of introducing Bitcoin futures on the underlying Bitcoin market efficiency: A multifractal analysis - ScienceDirect
4For more information, please refer to Bitcoin: Realised Price - Glassnode Studio
5For more information, please see Bitcoin: MVRV Z-Score - Glassnode Studio
6For more information, please see Bitcoin: Percent Supply in Profit - Glassnode Studio
7For more information, please see Bitcoin: Net Unrealised Profit/Loss (NUPL) - Glassnode Studio
8For more information, please refer to The Puell Multiple. A New Barometer of Bitcoin’s Market… | by cryptopoiesis | Unconfiscatable | Medium
9For more information, please refer to Hash Ribbons & Bitcoin Bottoms. When Miners give up, it’s possibly the… | by Charles Edwards | Capriole | Medium
10For more information, please refer to #1 Mayer Multiple Indicator Chart (Updated Daily) (buybitcoinworldwide.com)
11For more information, please refer to 200 Week Moving Average Heatmap | LookIntoBitcoin
12For more information, please refer to Quantifying Short-Term and Long-Term Holder Bitcoin Supply (glassnode.com)
13For more information, see The Expulsion of Bitcoin Tourists (glassnode.com)
14For more information, please refer to Bitcoin: Reserve Risk - Glassnode Studio
15For more information, see Aaro Capital: Equity and cryptocurrency risk factors
16For more information, please refer to The Expulsion of Bitcoin Tourists (glassnode.com)
17For more information, please refer to Bitcoin Obituaries - "Bitcoin is Dead" Declared 400+ Times (99bitcoins.com)
Disclaimer